| Red | Green | Blue | |
| z | 17.64 | ||
| znorm | Inf | ||
| sky | -NaN | -Inf | -Inf |
| S/N | 22.7 | 39.3 | 46.8 |
| S/N(c) | 0.0 | 0.0 | 0.0 |
| SN(E/C) |
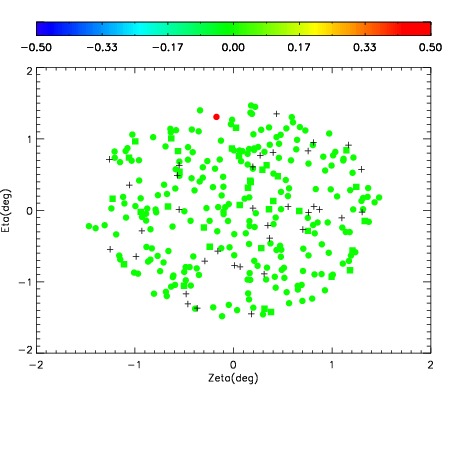
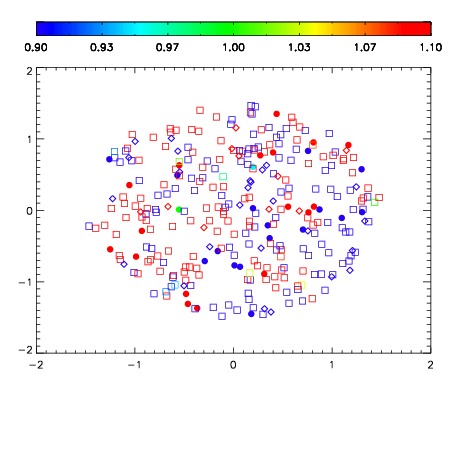
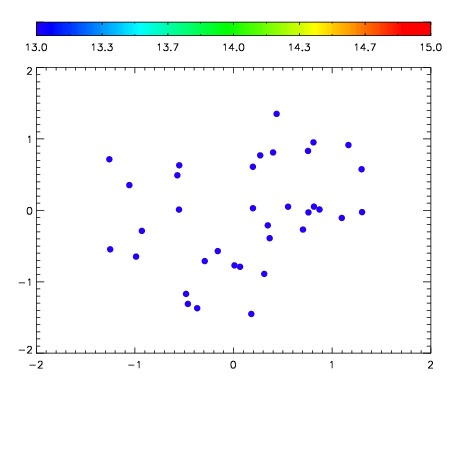

| Frame | Nreads | Zeropoints | Mag plots | Spatial mag deviation | Spatial sky 16325A emission deviations (filled: sky, open: star) | Spatial sky continuum emission | Spatial sky telluric CO2 absorption deviations (filled: H < 10) | |||||||||||||||||||||||
| 0 | 0 |
|
|
|
|
|
|
| IPAIR | NAME | SHIFT | NEWSHIFT | S/N | NAME | SHIFT | NEWSHIFT | S/N |
| 0 | 07500048 | 0.493222 | 0.00000 | 205.647 | 07500042 | 0.00000 | 0.493222 | 201.430 |
| 1 | 07500044 | 0.492307 | 0.000914991 | 206.245 | 07500046 | 0.00583321 | 0.487389 | 208.582 |
| 2 | 07500047 | 0.492469 | 0.000752985 | 205.997 | 07500049 | 0.00876966 | 0.484452 | 207.216 |
| 3 | 07500043 | 0.491216 | 0.00200599 | 201.278 | 07500045 | 0.00405645 | 0.489166 | 199.648 |