| Red | Green | Blue | |
| z | 17.64 | ||
| znorm | Inf | ||
| sky | -Inf | -Inf | -Inf |
| S/N | 27.6 | 49.4 | 53.9 |
| S/N(c) | 0.0 | 0.0 | 0.0 |
| SN(E/C) |
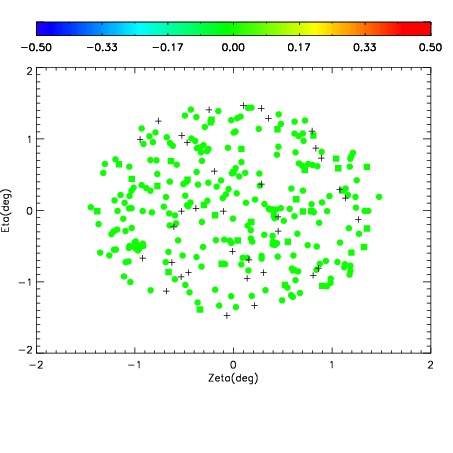
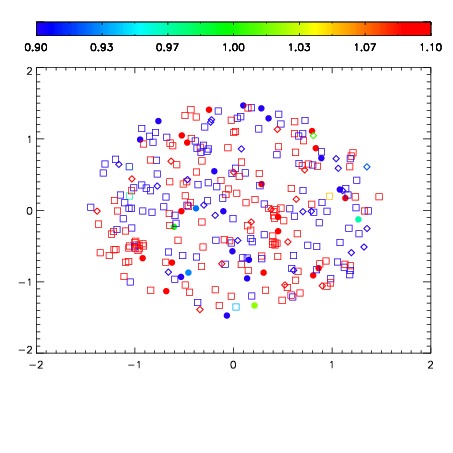
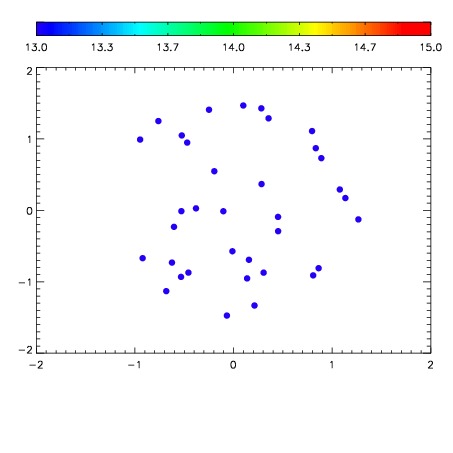

| Frame | Nreads | Zeropoints | Mag plots | Spatial mag deviation | Spatial sky 16325A emission deviations (filled: sky, open: star) | Spatial sky continuum emission | Spatial sky telluric CO2 absorption deviations (filled: H < 10) | |||||||||||||||||||||||
| 0 | 0 |
|
|
|
|
|
|
| IPAIR | NAME | SHIFT | NEWSHIFT | S/N | NAME | SHIFT | NEWSHIFT | S/N |
| 0 | 10790089 | 0.492623 | 0.00000 | 175.757 | 10790087 | -0.00381884 | 0.496442 | 175.704 |
| 1 | 10790086 | 0.490865 | 0.00175801 | 174.218 | 10790088 | -0.00356581 | 0.496189 | 174.353 |
| 2 | 10790090 | 0.492560 | 6.30021e-05 | 173.349 | 10790091 | -0.00361897 | 0.496242 | 172.187 |
| 3 | 10790085 | 0.491647 | 0.000975996 | 163.689 | 10790084 | -0.00390281 | 0.496526 | 163.839 |
| 4 | 10790081 | 0.491679 | 0.000943989 | 161.967 | 10790080 | 0.00000 | 0.492623 | 158.789 |
| 5 | 10790082 | 0.492096 | 0.000526994 | 159.209 | 10790083 | -0.00389896 | 0.496522 | 155.407 |