| Red | Green | Blue | |
| z | 17.64 | ||
| znorm | Inf | ||
| sky | -Inf | -Inf | -Inf |
| S/N | 27.8 | 47.0 | 51.8 |
| S/N(c) | 0.0 | 0.0 | 0.0 |
| SN(E/C) |
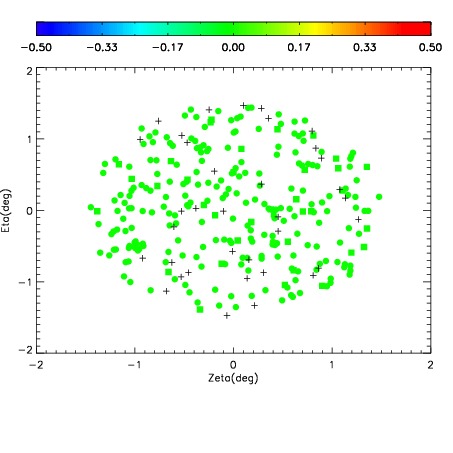
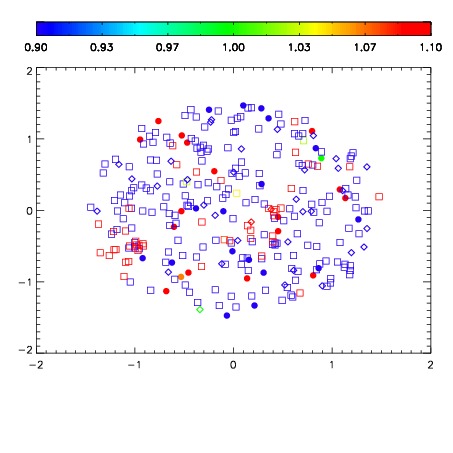
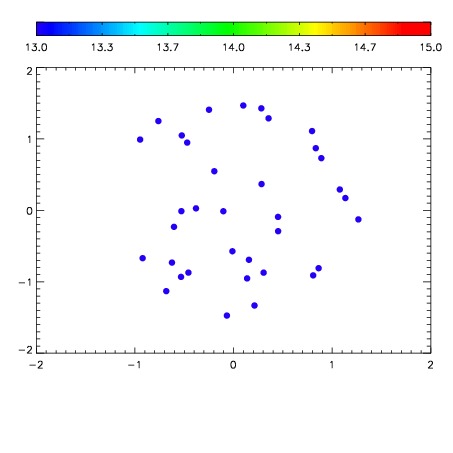

| Frame | Nreads | Zeropoints | Mag plots | Spatial mag deviation | Spatial sky 16325A emission deviations (filled: sky, open: star) | Spatial sky continuum emission | Spatial sky telluric CO2 absorption deviations (filled: H < 10) | |||||||||||||||||||||||
| 0 | 0 |
|
|
|
|
|
|
| IPAIR | NAME | SHIFT | NEWSHIFT | S/N | NAME | SHIFT | NEWSHIFT | S/N |
| 0 | 11110060 | 0.474518 | 0.00000 | 193.429 | 11110062 | -0.00265909 | 0.477177 | 194.767 |
| 1 | 11110064 | 0.472413 | 0.00210500 | 199.333 | 11110063 | -0.00281994 | 0.477338 | 201.021 |
| 2 | 11110065 | 0.473451 | 0.00106701 | 197.886 | 11110066 | -0.00268183 | 0.477200 | 196.749 |
| 3 | 11110061 | 0.474338 | 0.000180006 | 191.960 | 11110059 | 0.00000 | 0.474518 | 189.613 |