| Red | Green | Blue | |
| z | 17.64 | ||
| znorm | Inf | ||
| sky | -Inf | -Inf | -Inf |
| S/N | 26.1 | 44.2 | 46.8 |
| S/N(c) | 0.0 | 0.0 | 0.0 |
| SN(E/C) |
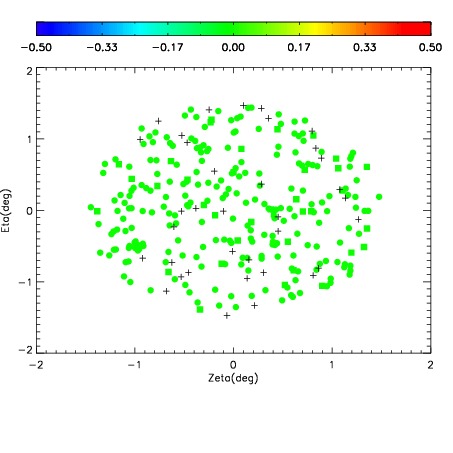
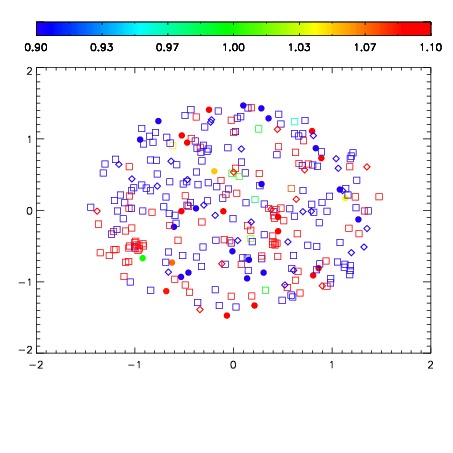
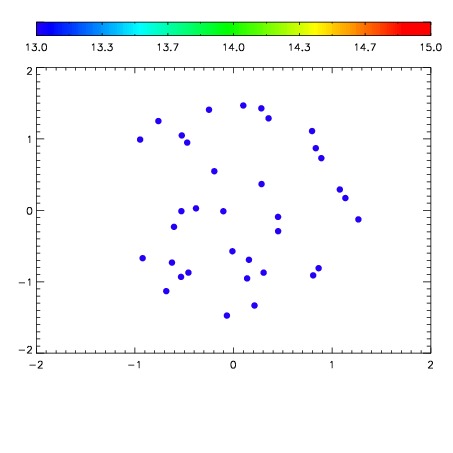

| Frame | Nreads | Zeropoints | Mag plots | Spatial mag deviation | Spatial sky 16325A emission deviations (filled: sky, open: star) | Spatial sky continuum emission | Spatial sky telluric CO2 absorption deviations (filled: H < 10) | |||||||||||||||||||||||
| 0 | 0 |
|
|
|
|
|
|
| IPAIR | NAME | SHIFT | NEWSHIFT | S/N | NAME | SHIFT | NEWSHIFT | S/N |
| 0 | 11150039 | 0.478078 | 0.00000 | 193.945 | 11150040 | -0.00117876 | 0.479257 | 192.947 |
| 1 | 11150042 | 0.475762 | 0.00231600 | 201.767 | 11150041 | -0.000366473 | 0.478444 | 197.347 |
| 2 | 11150038 | 0.477708 | 0.000369996 | 197.842 | 11150037 | 0.00000 | 0.478078 | 195.417 |
| 3 | 11150043 | 0.477259 | 0.000818998 | 196.122 | 11150044 | -0.00151967 | 0.479598 | 193.601 |