| Red | Green | Blue | |
| z | 17.64 | ||
| znorm | Inf | ||
| sky | -Inf | -Inf | -Inf |
| S/N | 24.2 | 41.7 | 44.7 |
| S/N(c) | 0.0 | 0.0 | 0.0 |
| SN(E/C) |
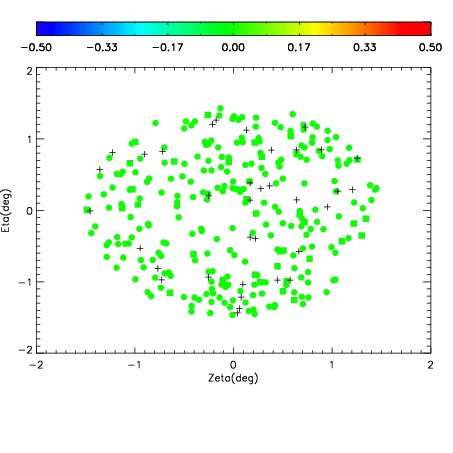
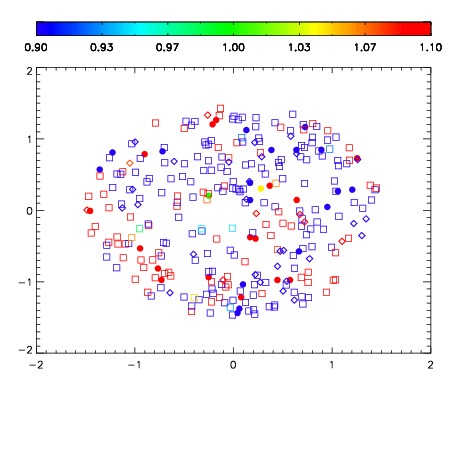
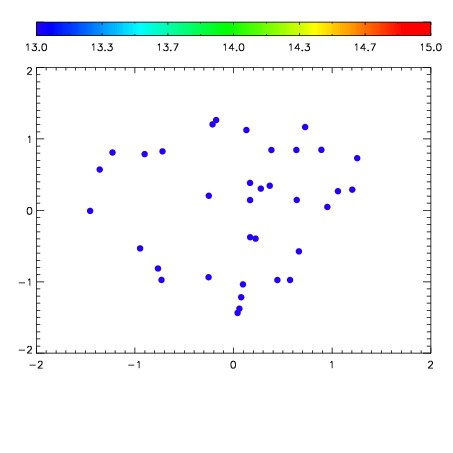

| Frame | Nreads | Zeropoints | Mag plots | Spatial mag deviation | Spatial sky 16325A emission deviations (filled: sky, open: star) | Spatial sky continuum emission | Spatial sky telluric CO2 absorption deviations (filled: H < 10) | |||||||||||||||||||||||
| 0 | 0 |
|
|
|
|
|
|
| IPAIR | NAME | SHIFT | NEWSHIFT | S/N | NAME | SHIFT | NEWSHIFT | S/N |
| 0 | 07850032 | 0.471398 | 0.00000 | 134.387 | 07850026 | 0.00000 | 0.471398 | 136.702 |
| 1 | 07850028 | 0.470301 | 0.00109699 | 149.139 | 07850029 | -0.00270864 | 0.474107 | 151.818 |
| 2 | 07850027 | 0.470910 | 0.000487983 | 146.223 | 07850033 | -0.00186769 | 0.473266 | 146.590 |
| 3 | 07850031 | 0.470218 | 0.00117999 | 140.929 | 07850030 | -0.00294786 | 0.474346 | 142.880 |