| Red | Green | Blue | |
| z | 17.64 | ||
| znorm | Inf | ||
| sky | -NaN | -NaN | -Inf |
| S/N | 26.3 | 44.8 | 48.5 |
| S/N(c) | 0.0 | 0.0 | 0.0 |
| SN(E/C) |
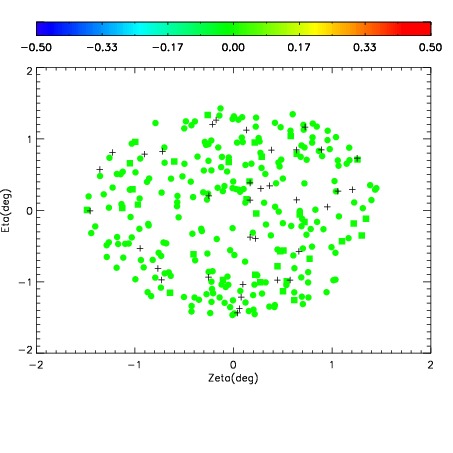
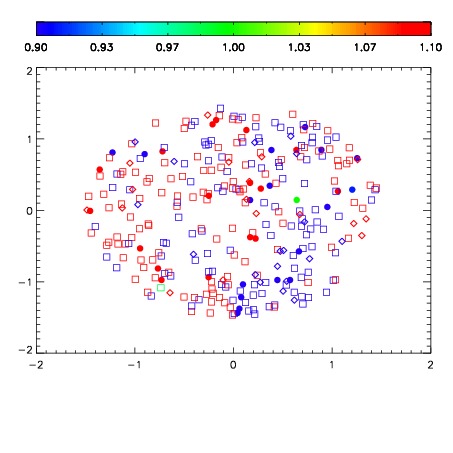
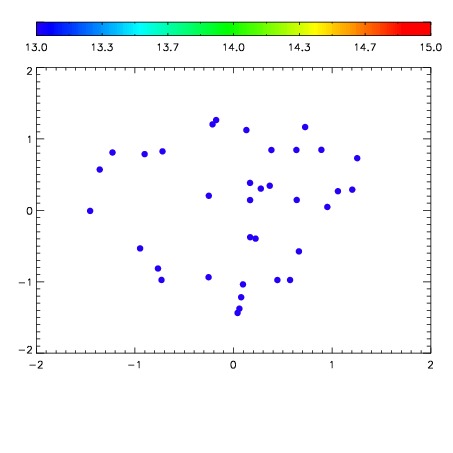

| Frame | Nreads | Zeropoints | Mag plots | Spatial mag deviation | Spatial sky 16325A emission deviations (filled: sky, open: star) | Spatial sky continuum emission | Spatial sky telluric CO2 absorption deviations (filled: H < 10) | |||||||||||||||||||||||
| 0 | 0 |
|
|
|
|
|
|
| IPAIR | NAME | SHIFT | NEWSHIFT | S/N | NAME | SHIFT | NEWSHIFT | S/N |
| 0 | 07900017 | 0.469607 | 0.00000 | 152.590 | 07900018 | 0.00224164 | 0.467365 | 151.902 |
| 1 | 07900016 | 0.469194 | 0.000413001 | 149.777 | 07900015 | 0.00123966 | 0.468367 | 149.727 |
| 2 | 07900013 | 0.469441 | 0.000165999 | 149.327 | 07900014 | -0.000864538 | 0.470472 | 147.826 |
| 3 | 07900012 | 0.468090 | 0.00151700 | 145.805 | 07900011 | 0.00000 | 0.469607 | 146.436 |