| Red | Green | Blue | |
| z | 17.64 | ||
| znorm | Inf | ||
| sky | -Inf | -Inf | -Inf |
| S/N | 21.9 | 41.4 | 43.9 |
| S/N(c) | 0.0 | 0.0 | 0.0 |
| SN(E/C) |
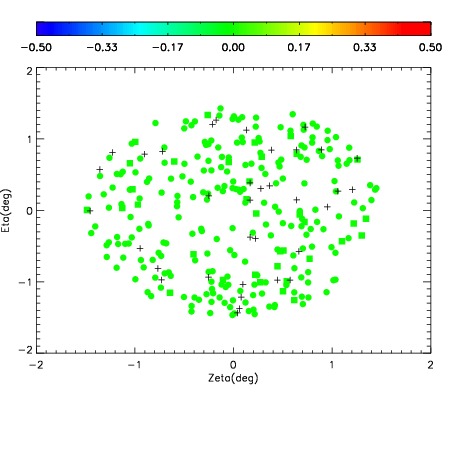
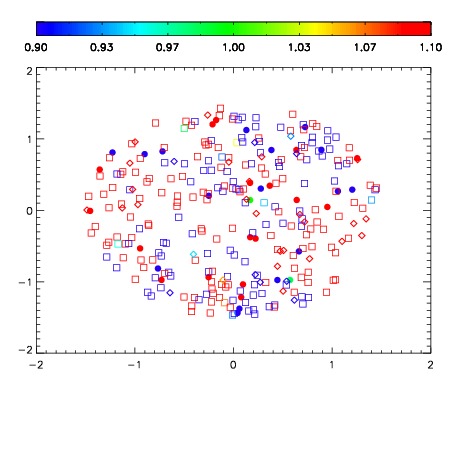
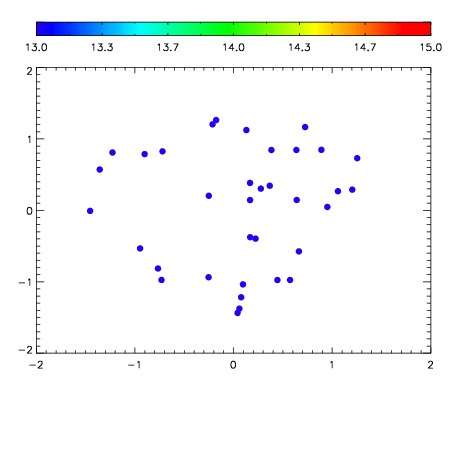

| Frame | Nreads | Zeropoints | Mag plots | Spatial mag deviation | Spatial sky 16325A emission deviations (filled: sky, open: star) | Spatial sky continuum emission | Spatial sky telluric CO2 absorption deviations (filled: H < 10) | |||||||||||||||||||||||
| 0 | 0 |
|
|
|
|
|
|
| IPAIR | NAME | SHIFT | NEWSHIFT | S/N | NAME | SHIFT | NEWSHIFT | S/N |
| 0 | 10610052 | 0.504129 | 0.00000 | 128.823 | 10610061 | 3.52447e-05 | 0.504094 | 133.479 |
| 1 | 10610060 | 0.502695 | 0.00143397 | 133.184 | 10610058 | 0.00153307 | 0.502596 | 136.103 |
| 2 | 10610059 | 0.503012 | 0.00111699 | 132.174 | 10610057 | 0.00211906 | 0.502010 | 135.934 |
| 3 | 10610051 | 0.503802 | 0.000326991 | 126.406 | 10610050 | 0.00000 | 0.504129 | 130.509 |
| 4 | 10610056 | 0.504119 | 1.00136e-05 | 116.685 | 10610053 | 0.00156079 | 0.502568 | 129.603 |
| 5 | 10610055 | 0.503929 | 0.000199974 | 113.671 | 10610054 | 0.00186755 | 0.502261 | 123.932 |