| Red | Green | Blue | |
| z | 17.64 | ||
| znorm | Inf | ||
| sky | -Inf | -Inf | -Inf |
| S/N | 28.9 | 49.9 | 53.6 |
| S/N(c) | 0.0 | 0.0 | 0.0 |
| SN(E/C) |
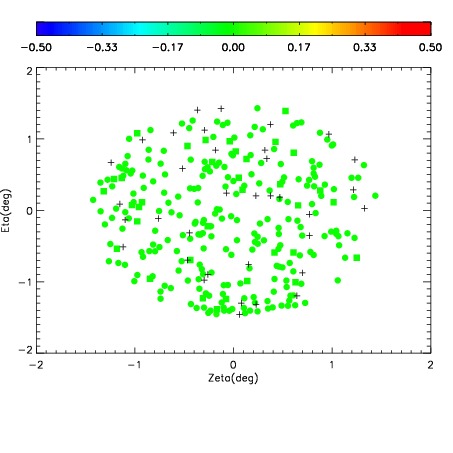
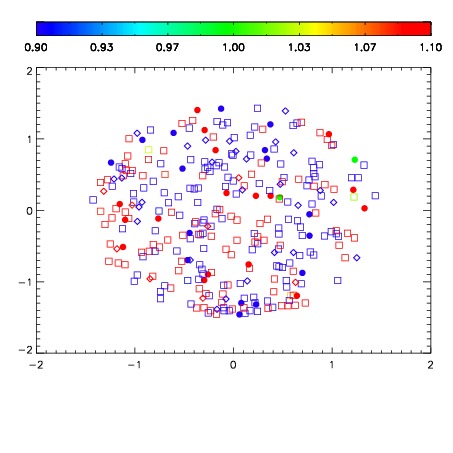
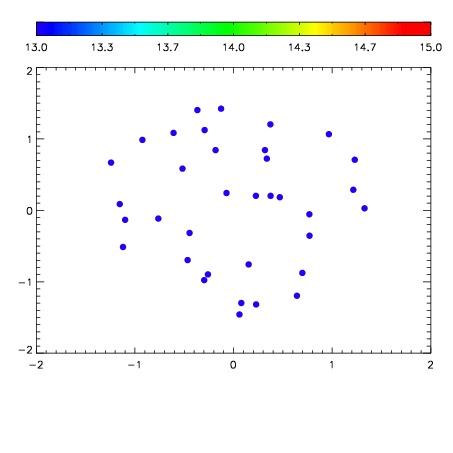

| Frame | Nreads | Zeropoints | Mag plots | Spatial mag deviation | Spatial sky 16325A emission deviations (filled: sky, open: star) | Spatial sky continuum emission | Spatial sky telluric CO2 absorption deviations (filled: H < 10) | |||||||||||||||||||||||
| 0 | 0 |
|
|
|
|
|
|
| IPAIR | NAME | SHIFT | NEWSHIFT | S/N | NAME | SHIFT | NEWSHIFT | S/N |
| 0 | 06980061 | 0.482058 | 0.00000 | 172.988 | 06980059 | 0.00000 | 0.482058 | 165.853 |
| 1 | 06980065 | 0.480237 | 0.00182098 | 177.699 | 06980066 | -0.000671721 | 0.482730 | 179.551 |
| 2 | 06980060 | 0.480747 | 0.00131097 | 174.826 | 06980063 | 0.000321646 | 0.481736 | 178.360 |
| 3 | 06980064 | 0.479863 | 0.00219500 | 173.899 | 06980062 | 0.000817202 | 0.481241 | 176.123 |