| Red | Green | Blue | |
| z | 17.64 | ||
| znorm | Inf | ||
| sky | -Inf | -NaN | -Inf |
| S/N | 24.6 | 43.5 | 47.1 |
| S/N(c) | 0.0 | 0.0 | 0.0 |
| SN(E/C) |

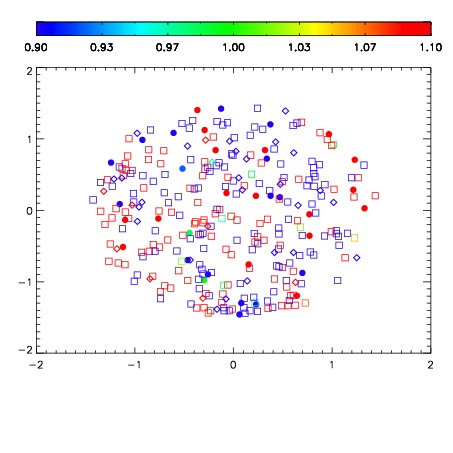
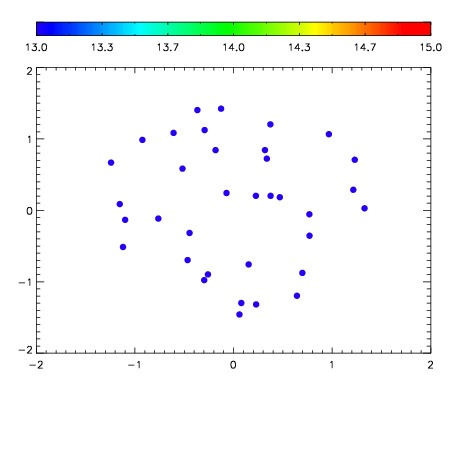

| Frame | Nreads | Zeropoints | Mag plots | Spatial mag deviation | Spatial sky 16325A emission deviations (filled: sky, open: star) | Spatial sky continuum emission | Spatial sky telluric CO2 absorption deviations (filled: H < 10) | |||||||||||||||||||||||
| 0 | 0 |
|
|
|
|
|
|
| IPAIR | NAME | SHIFT | NEWSHIFT | S/N | NAME | SHIFT | NEWSHIFT | S/N |
| 0 | 07030027 | 0.470126 | 0.00000 | 165.388 | 07030028 | -0.000227401 | 0.470353 | 165.890 |
| 1 | 07030031 | 0.468719 | 0.00140700 | 168.498 | 07030029 | -0.000482792 | 0.470609 | 170.113 |
| 2 | 07030030 | 0.468373 | 0.00175300 | 168.128 | 07030032 | 0.000224328 | 0.469902 | 169.690 |
| 3 | 07030026 | 0.468958 | 0.00116801 | 157.995 | 07030025 | 0.00000 | 0.470126 | 156.190 |