| Red | Green | Blue | |
| z | 17.64 | ||
| znorm | Inf | ||
| sky | -Inf | -Inf | -Inf |
| S/N | 27.7 | 47.1 | 51.4 |
| S/N(c) | 0.0 | 0.0 | 0.0 |
| SN(E/C) |
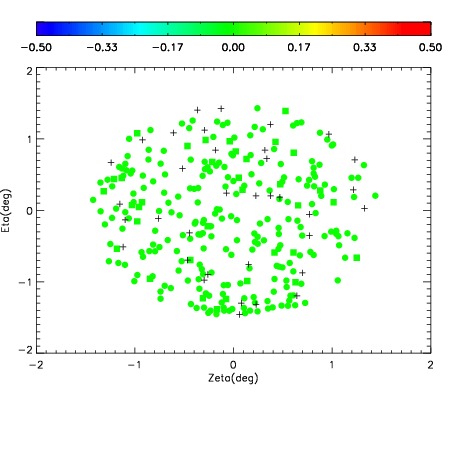
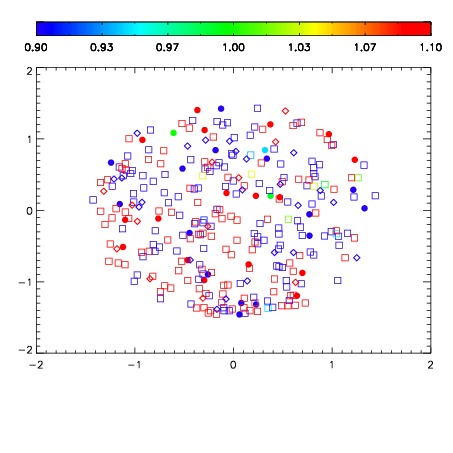
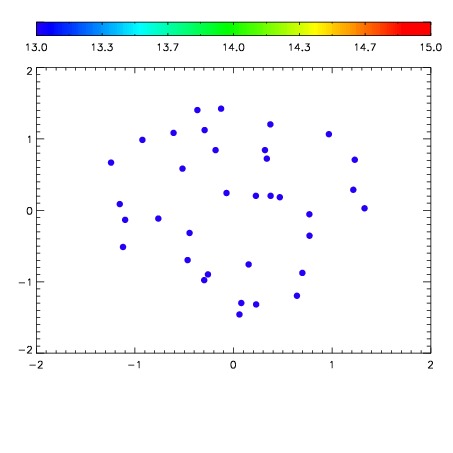

| Frame | Nreads | Zeropoints | Mag plots | Spatial mag deviation | Spatial sky 16325A emission deviations (filled: sky, open: star) | Spatial sky continuum emission | Spatial sky telluric CO2 absorption deviations (filled: H < 10) | |||||||||||||||||||||||
| 0 | 0 |
|
|
|
|
|
|
| IPAIR | NAME | SHIFT | NEWSHIFT | S/N | NAME | SHIFT | NEWSHIFT | S/N |
| 0 | 10210091 | 0.490852 | 0.00000 | 191.444 | 10210092 | 0.00246531 | 0.488387 | 192.184 |
| 1 | 10210090 | 0.489883 | 0.000968993 | 188.918 | 10210089 | 0.00289662 | 0.487955 | 187.773 |
| 2 | 10210087 | 0.489045 | 0.00180700 | 185.699 | 10210088 | 0.00283581 | 0.488016 | 187.301 |
| 3 | 10210086 | 0.488929 | 0.00192299 | 181.208 | 10210085 | 0.00000 | 0.490852 | 174.127 |