| Red | Green | Blue | |
| z | 17.64 | ||
| znorm | Inf | ||
| sky | -Inf | -Inf | -Inf |
| S/N | 15.3 | 27.8 | 31.1 |
| S/N(c) | 0.0 | 0.0 | 0.0 |
| SN(E/C) |
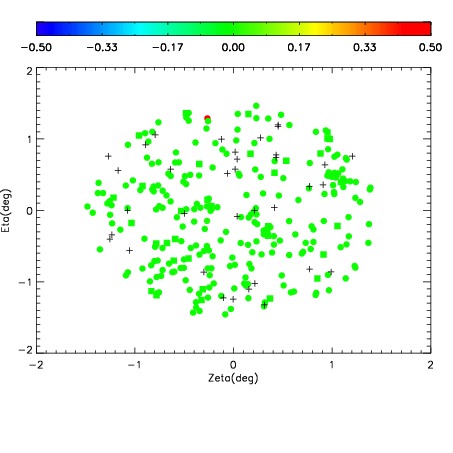
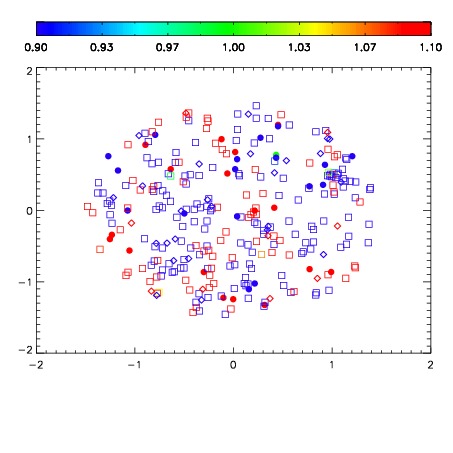
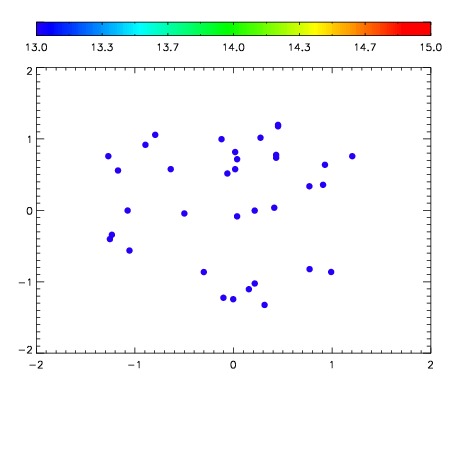

| Frame | Nreads | Zeropoints | Mag plots | Spatial mag deviation | Spatial sky 16325A emission deviations (filled: sky, open: star) | Spatial sky continuum emission | Spatial sky telluric CO2 absorption deviations (filled: H < 10) | |||||||||||||||||||||||
| 0 | 0 |
|
|
|
|
|
|
| IPAIR | NAME | SHIFT | NEWSHIFT | S/N | NAME | SHIFT | NEWSHIFT | S/N |
| 0 | 07540039 | 0.475188 | 0.00000 | 143.638 | 07540037 | 0.00000 | 0.475188 | 150.235 |
| 1 | 07540043 | 0.471402 | 0.00378600 | 195.380 | 07540044 | -0.00154185 | 0.476730 | 184.187 |
| 2 | 07540038 | 0.474376 | 0.000811994 | 162.215 | 07540040 | -0.000438052 | 0.475626 | 168.904 |
| 3 | 07540042 | 0.471743 | 0.00344500 | 116.418 | 07540041 | -0.00194977 | 0.477138 | 115.535 |