| Red | Green | Blue | |
| z | 17.64 | ||
| znorm | Inf | ||
| sky | -Inf | -Inf | -Inf |
| S/N | 26.9 | 47.0 | 52.6 |
| S/N(c) | 0.0 | 0.0 | 0.0 |
| SN(E/C) |
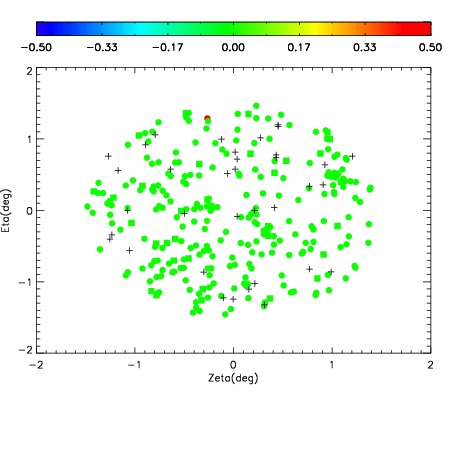
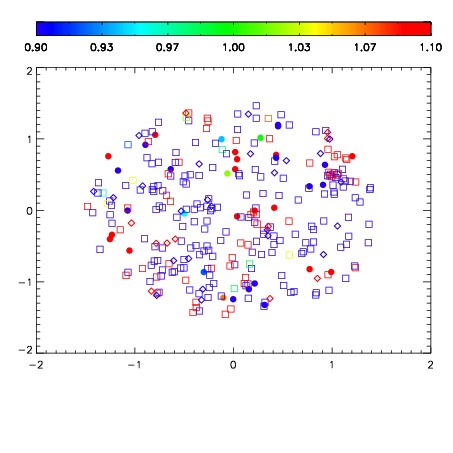
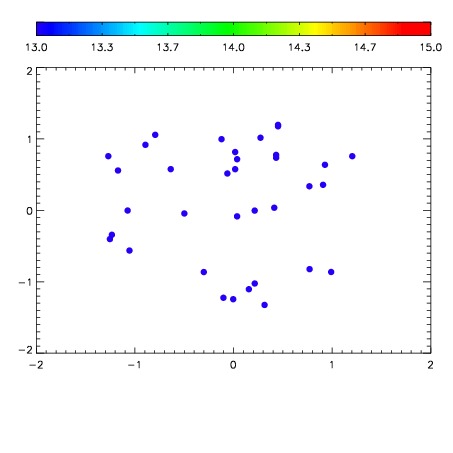

| Frame | Nreads | Zeropoints | Mag plots | Spatial mag deviation | Spatial sky 16325A emission deviations (filled: sky, open: star) | Spatial sky continuum emission | Spatial sky telluric CO2 absorption deviations (filled: H < 10) | |||||||||||||||||||||||
| 0 | 0 |
|
|
|
|
|
|
| IPAIR | NAME | SHIFT | NEWSHIFT | S/N | NAME | SHIFT | NEWSHIFT | S/N |
| 0 | 10200101 | 0.000224572 | 0.00000 | 251.657 | 10200095 | -0.495468 | 0.495693 | 256.324 |
| 1 | 10200097 | -0.00145188 | 0.00167645 | 254.422 | 10200096 | -0.495639 | 0.495864 | 256.363 |
| 2 | 10200094 | 0.00000 | 0.000224572 | 246.888 | 10200099 | -0.494458 | 0.494683 | 247.586 |
| 3 | 10200098 | -0.00160519 | 0.00182976 | 243.887 | 10200100 | -0.494631 | 0.494856 | 244.759 |