| Red | Green | Blue | |
| z | 17.64 | ||
| znorm | Inf | ||
| sky | -Inf | -Inf | -Inf |
| S/N | 21.8 | 38.1 | 40.7 |
| S/N(c) | 0.0 | 0.0 | 0.0 |
| SN(E/C) |
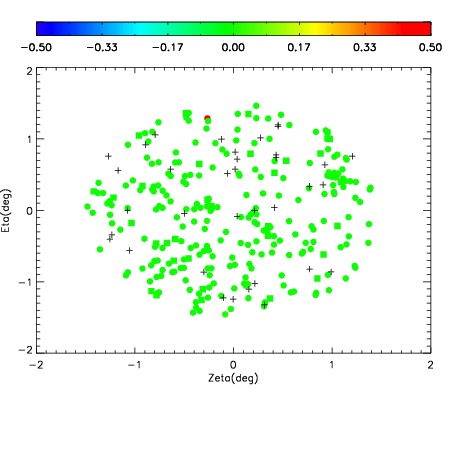
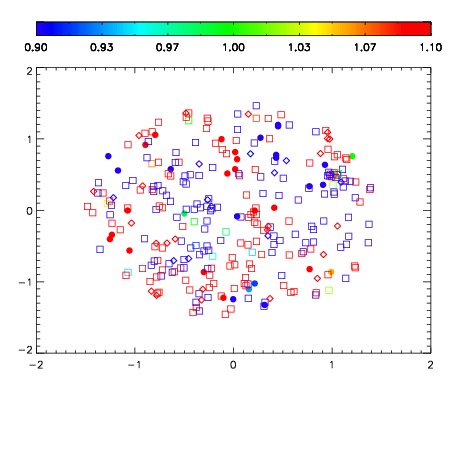
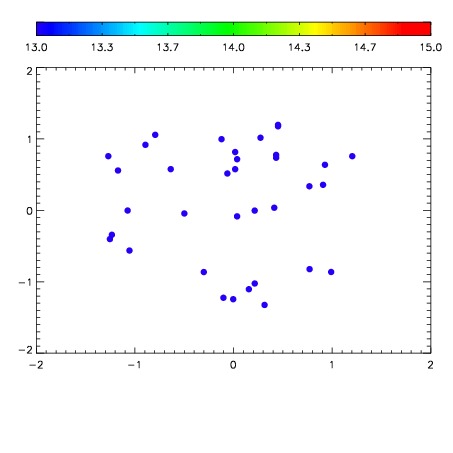

| Frame | Nreads | Zeropoints | Mag plots | Spatial mag deviation | Spatial sky 16325A emission deviations (filled: sky, open: star) | Spatial sky continuum emission | Spatial sky telluric CO2 absorption deviations (filled: H < 10) | |||||||||||||||||||||||
| 0 | 0 |
|
|
|
|
|
|
| IPAIR | NAME | SHIFT | NEWSHIFT | S/N | NAME | SHIFT | NEWSHIFT | S/N |
| 0 | 10810056 | 0.487179 | 0.00000 | 200.632 | 10810057 | 0.00109670 | 0.486082 | 187.953 |
| 1 | 10810051 | 0.485823 | 0.00135601 | 223.414 | 10810050 | 0.00000 | 0.487179 | 219.713 |
| 2 | 10810052 | 0.486902 | 0.000277013 | 214.613 | 10810054 | 0.00162020 | 0.485559 | 216.037 |
| 3 | 10810055 | 0.486435 | 0.000744015 | 207.358 | 10810053 | 0.00121857 | 0.485960 | 208.119 |