| Red | Green | Blue | |
| z | 17.64 | ||
| znorm | Inf | ||
| sky | -Inf | -NaN | -Inf |
| S/N | 16.9 | 31.9 | 32.7 |
| S/N(c) | 0.0 | 0.0 | 0.0 |
| SN(E/C) |
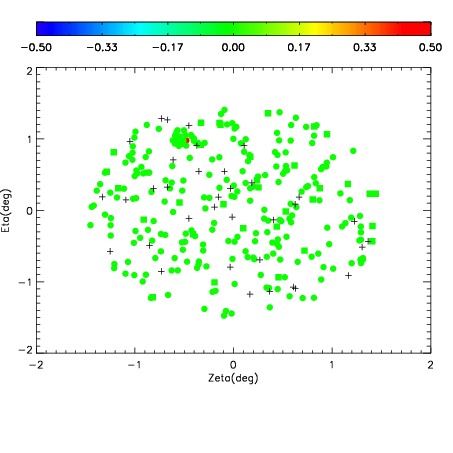
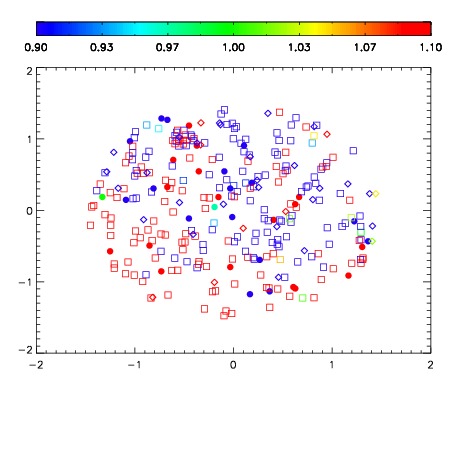
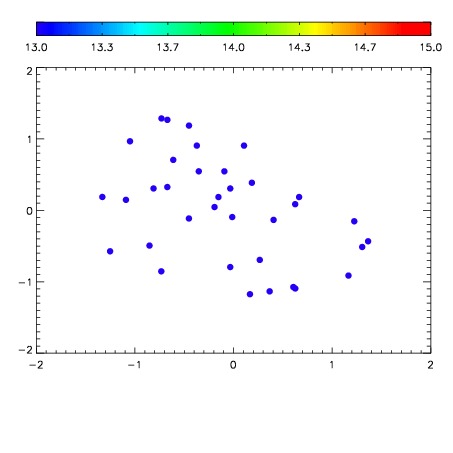

| Frame | Nreads | Zeropoints | Mag plots | Spatial mag deviation | Spatial sky 16325A emission deviations (filled: sky, open: star) | Spatial sky continuum emission | Spatial sky telluric CO2 absorption deviations (filled: H < 10) | |||||||||||||||||||||||
| 0 | 0 |
|
|
|
|
|
|
| IPAIR | NAME | SHIFT | NEWSHIFT | S/N | NAME | SHIFT | NEWSHIFT | S/N |
| 0 | 07050017 | 0.470293 | 0.00000 | 140.666 | 07050015 | 0.00485945 | 0.465434 | 136.633 |
| 1 | 07050012 | 0.468220 | 0.00207299 | 159.897 | 07050011 | 0.00000 | 0.470293 | 158.288 |
| 2 | 07050013 | 0.469574 | 0.000718981 | 155.433 | 07050014 | 0.00315416 | 0.467139 | 144.152 |
| 3 | 07050016 | 0.469525 | 0.000767976 | 148.818 | 07050018 | 0.00291541 | 0.467378 | 139.705 |