| Red | Green | Blue | |
| z | 17.64 | ||
| znorm | Inf | ||
| sky | -Inf | -Inf | -Inf |
| S/N | 26.0 | 45.1 | 48.8 |
| S/N(c) | 0.0 | 0.0 | 0.0 |
| SN(E/C) |
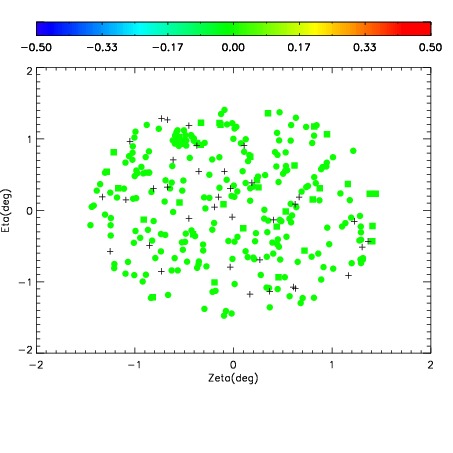
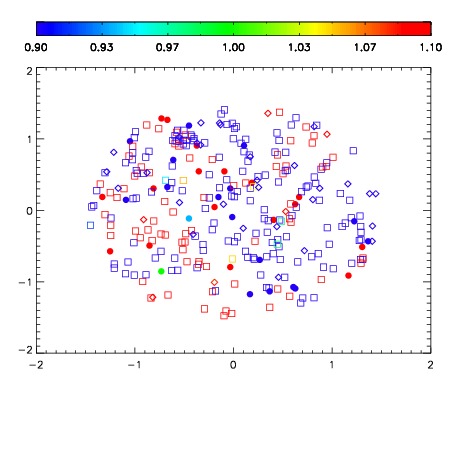
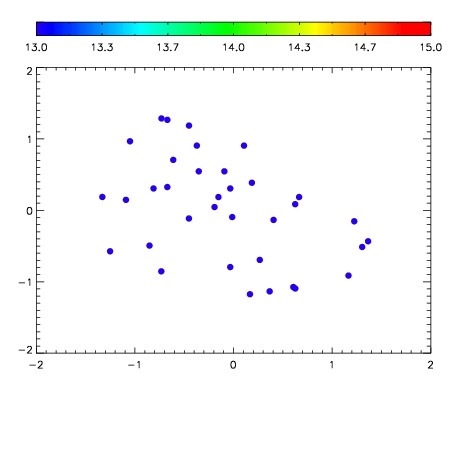

| Frame | Nreads | Zeropoints | Mag plots | Spatial mag deviation | Spatial sky 16325A emission deviations (filled: sky, open: star) | Spatial sky continuum emission | Spatial sky telluric CO2 absorption deviations (filled: H < 10) | |||||||||||||||||||||||
| 0 | 0 |
|
|
|
|
|
|
| IPAIR | NAME | SHIFT | NEWSHIFT | S/N | NAME | SHIFT | NEWSHIFT | S/N |
| 0 | 07280050 | 0.488555 | 0.00000 | 213.737 | 07280052 | 0.00168681 | 0.486868 | 205.815 |
| 1 | 07280049 | 0.488278 | 0.000277013 | 214.724 | 07280048 | 0.00000 | 0.488555 | 207.132 |
| 2 | 07280054 | 0.487138 | 0.00141701 | 212.633 | 07280055 | 0.00481118 | 0.483744 | 200.972 |
| 3 | 07280053 | 0.486395 | 0.00216001 | 209.855 | 07280051 | 0.00179323 | 0.486762 | 200.645 |