| Red | Green | Blue | |
| z | 17.64 | ||
| znorm | Inf | ||
| sky | -Inf | -NaN | -Inf |
| S/N | 26.9 | 43.2 | 45.2 |
| S/N(c) | 0.0 | 0.0 | 0.0 |
| SN(E/C) |
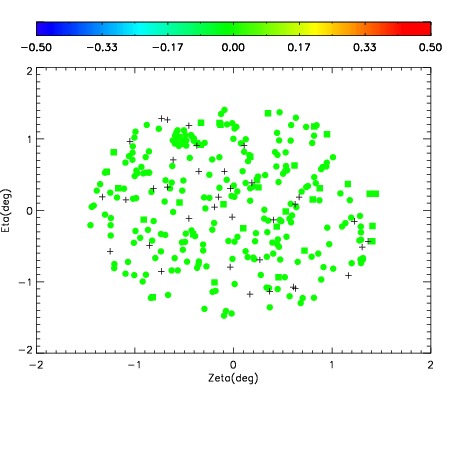
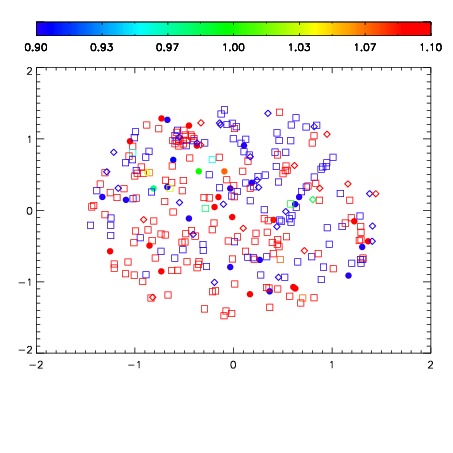
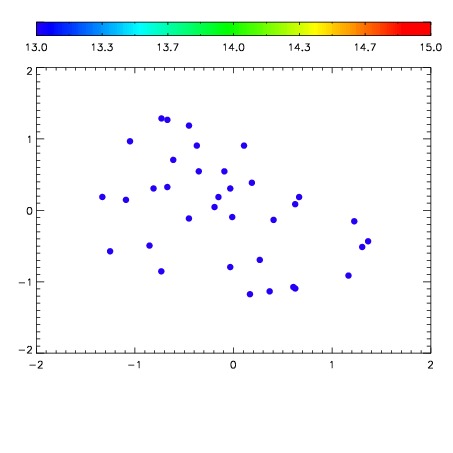

| Frame | Nreads | Zeropoints | Mag plots | Spatial mag deviation | Spatial sky 16325A emission deviations (filled: sky, open: star) | Spatial sky continuum emission | Spatial sky telluric CO2 absorption deviations (filled: H < 10) | |||||||||||||||||||||||
| 0 | 0 |
|
|
|
|
|
|
| IPAIR | NAME | SHIFT | NEWSHIFT | S/N | NAME | SHIFT | NEWSHIFT | S/N |
| 0 | 07830023 | 0.470823 | 0.00000 | 180.581 | 07830021 | 0.00000 | 0.470823 | 188.578 |
| 1 | 07830027 | 0.470014 | 0.000808984 | 206.972 | 07830028 | 0.00157830 | 0.469245 | 211.972 |
| 2 | 07830026 | 0.469256 | 0.00156698 | 204.514 | 07830025 | -0.00136320 | 0.472186 | 208.924 |
| 3 | 07830022 | 0.470720 | 0.000102997 | 199.958 | 07830024 | -0.000699298 | 0.471522 | 204.644 |