| Red | Green | Blue | |
| z | 17.64 | ||
| znorm | Inf | ||
| sky | -Inf | -Inf | -Inf |
| S/N | 24.6 | 43.0 | 48.7 |
| S/N(c) | 0.0 | 0.0 | 0.0 |
| SN(E/C) |
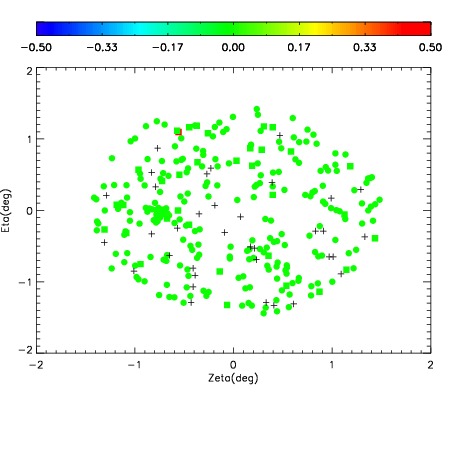

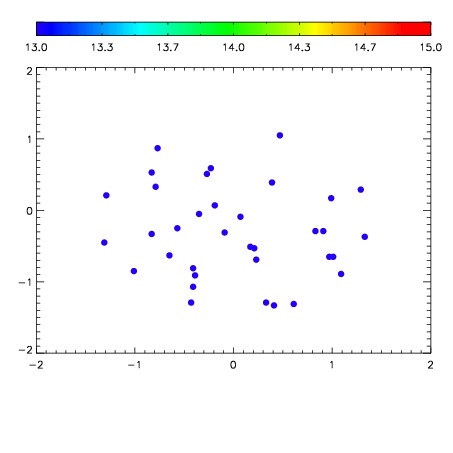

| Frame | Nreads | Zeropoints | Mag plots | Spatial mag deviation | Spatial sky 16325A emission deviations (filled: sky, open: star) | Spatial sky continuum emission | Spatial sky telluric CO2 absorption deviations (filled: H < 10) | |||||||||||||||||||||||
| 0 | 0 |
|
|
|
|
|
|
| IPAIR | NAME | SHIFT | NEWSHIFT | S/N | NAME | SHIFT | NEWSHIFT | S/N |
| 0 | 11110046 | 0.476390 | 0.00000 | 203.799 | 11110044 | 0.00000 | 0.476390 | 199.639 |
| 1 | 11110050 | 0.472980 | 0.00341001 | 214.446 | 11110051 | -0.00344268 | 0.479833 | 220.594 |
| 2 | 11110049 | 0.473371 | 0.00301901 | 214.254 | 11110048 | -0.00174136 | 0.478131 | 216.938 |
| 3 | 11110045 | 0.475518 | 0.000872016 | 209.114 | 11110047 | -0.000433868 | 0.476824 | 208.777 |