| Red | Green | Blue | |
| z | 17.64 | ||
| znorm | Inf | ||
| sky | -Inf | -Inf | -Inf |
| S/N | 24.6 | 44.1 | 47.8 |
| S/N(c) | 0.0 | 0.0 | 0.0 |
| SN(E/C) |
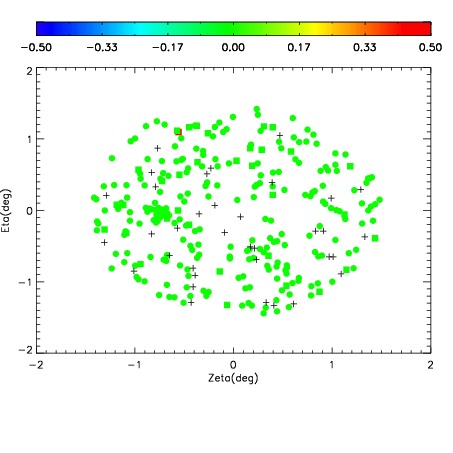
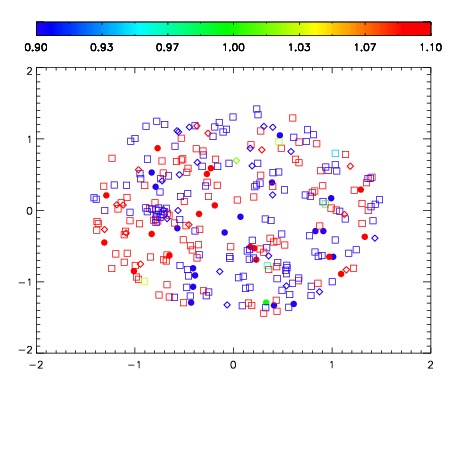
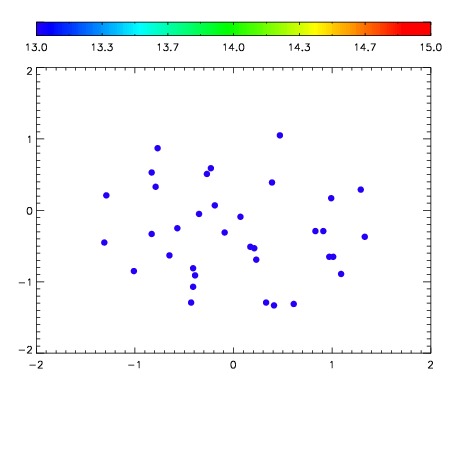

| Frame | Nreads | Zeropoints | Mag plots | Spatial mag deviation | Spatial sky 16325A emission deviations (filled: sky, open: star) | Spatial sky continuum emission | Spatial sky telluric CO2 absorption deviations (filled: H < 10) | |||||||||||||||||||||||
| 0 | 0 |
|
|
|
|
|
|
| IPAIR | NAME | SHIFT | NEWSHIFT | S/N | NAME | SHIFT | NEWSHIFT | S/N |
| 0 | 11150028 | 0.480691 | 0.00000 | 212.797 | 11150026 | -0.00318305 | 0.483874 | 208.941 |
| 1 | 11150027 | 0.479827 | 0.000863999 | 214.403 | 11150029 | -0.00168182 | 0.482373 | 213.120 |
| 2 | 11150024 | 0.480261 | 0.000429988 | 203.531 | 11150025 | -0.00345301 | 0.484144 | 204.327 |
| 3 | 11150023 | 0.479236 | 0.00145498 | 201.878 | 11150022 | 0.00000 | 0.480691 | 185.188 |