| Red | Green | Blue | |
| z | 17.64 | ||
| znorm | Inf | ||
| sky | -Inf | -Inf | -Inf |
| S/N | 26.3 | 45.5 | 49.7 |
| S/N(c) | 0.0 | 0.0 | 0.0 |
| SN(E/C) |
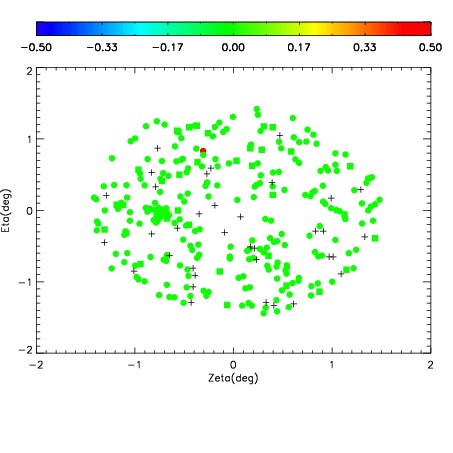
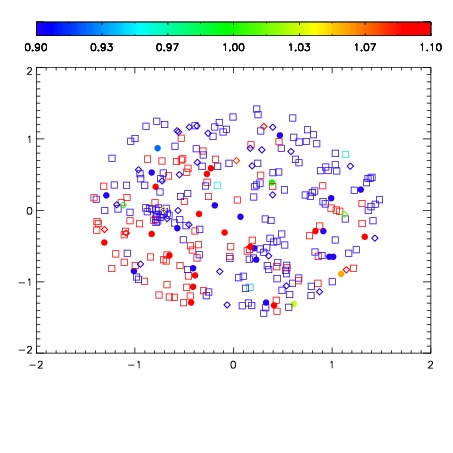
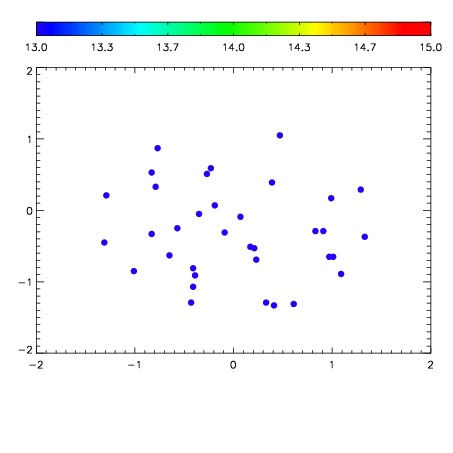

| Frame | Nreads | Zeropoints | Mag plots | Spatial mag deviation | Spatial sky 16325A emission deviations (filled: sky, open: star) | Spatial sky continuum emission | Spatial sky telluric CO2 absorption deviations (filled: H < 10) | |||||||||||||||||||||||
| 0 | 0 |
|
|
|
|
|
|
| IPAIR | NAME | SHIFT | NEWSHIFT | S/N | NAME | SHIFT | NEWSHIFT | S/N |
| 0 | 11380043 | 0.473902 | 0.00000 | 229.873 | 11380040 | -0.00160236 | 0.475504 | 230.875 |
| 1 | 11380042 | 0.473043 | 0.000858992 | 225.227 | 11380041 | -0.00143298 | 0.475335 | 226.114 |
| 2 | 11380039 | 0.472880 | 0.00102198 | 224.073 | 11380044 | -0.000508733 | 0.474411 | 225.158 |
| 3 | 11380038 | 0.472467 | 0.00143498 | 220.461 | 11380037 | 0.00000 | 0.473902 | 216.788 |