| Red | Green | Blue | |
| z | 17.64 | ||
| znorm | Inf | ||
| sky | -Inf | -Inf | -Inf |
| S/N | 27.5 | 47.9 | 52.4 |
| S/N(c) | 0.0 | 0.0 | 0.0 |
| SN(E/C) |
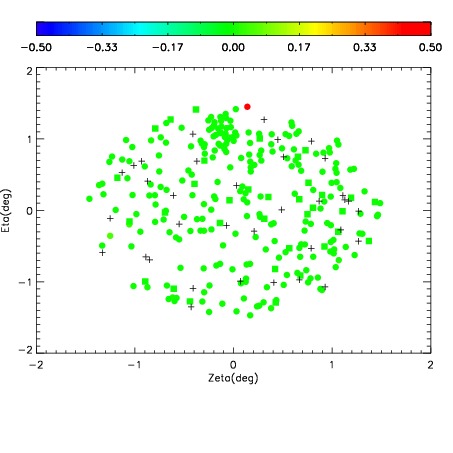
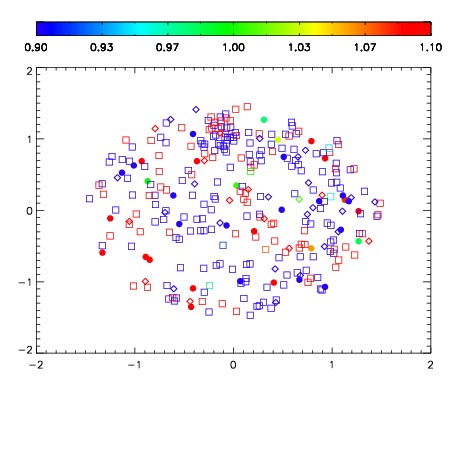
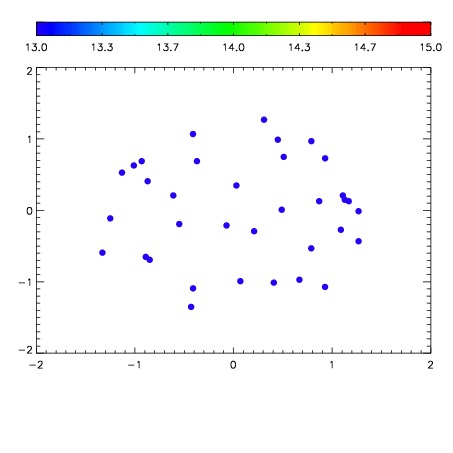

| Frame | Nreads | Zeropoints | Mag plots | Spatial mag deviation | Spatial sky 16325A emission deviations (filled: sky, open: star) | Spatial sky continuum emission | Spatial sky telluric CO2 absorption deviations (filled: H < 10) | |||||||||||||||||||||||
| 0 | 0 |
|
|
|
|
|
|
| IPAIR | NAME | SHIFT | NEWSHIFT | S/N | NAME | SHIFT | NEWSHIFT | S/N |
| 0 | 10220102 | 0.495939 | 0.00000 | 256.569 | 10220100 | 0.00150206 | 0.494437 | 258.502 |
| 1 | 10220101 | 0.495694 | 0.000244975 | 258.653 | 10220103 | 0.00182105 | 0.494118 | 258.594 |
| 2 | 10220098 | 0.494625 | 0.00131398 | 252.914 | 10220099 | 0.00177828 | 0.494161 | 258.367 |
| 3 | 10220097 | 0.493926 | 0.00201300 | 252.414 | 10220096 | 0.00000 | 0.495939 | 244.917 |