| Red | Green | Blue | |
| z | 17.64 | ||
| znorm | Inf | ||
| sky | -Inf | -Inf | -Inf |
| S/N | 23.8 | 42.4 | 45.8 |
| S/N(c) | 0.0 | 0.0 | 0.0 |
| SN(E/C) |
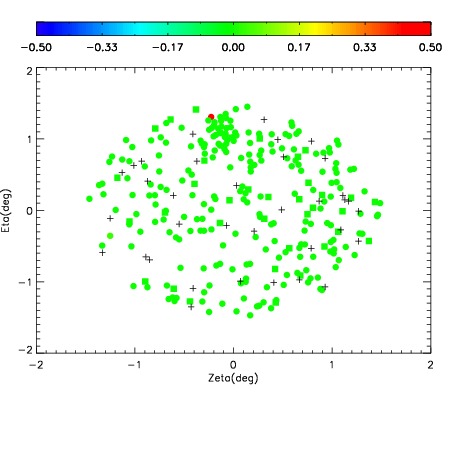
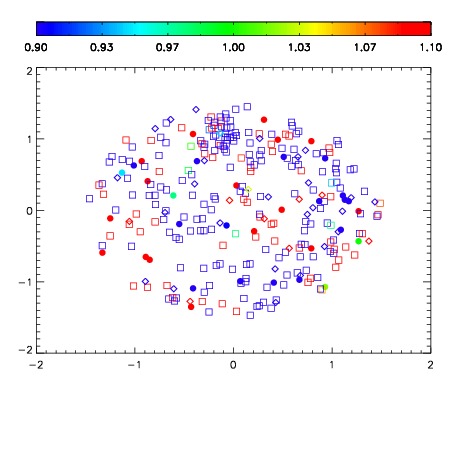
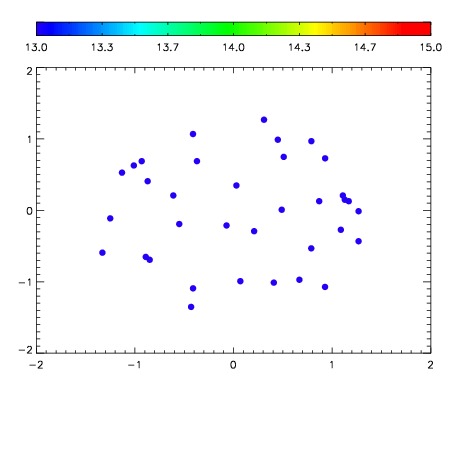

| Frame | Nreads | Zeropoints | Mag plots | Spatial mag deviation | Spatial sky 16325A emission deviations (filled: sky, open: star) | Spatial sky continuum emission | Spatial sky telluric CO2 absorption deviations (filled: H < 10) | |||||||||||||||||||||||
| 0 | 0 |
|
|
|
|
|
|
| IPAIR | NAME | SHIFT | NEWSHIFT | S/N | NAME | SHIFT | NEWSHIFT | S/N |
| 0 | 10270085 | 0.495656 | 0.00000 | 185.306 | 10270086 | 0.00267148 | 0.492985 | 187.198 |
| 1 | 10270080 | 0.494902 | 0.000753999 | 200.122 | 10270082 | 0.00293974 | 0.492716 | 194.436 |
| 2 | 10270081 | 0.495651 | 5.00679e-06 | 196.433 | 10270083 | 0.00334559 | 0.492310 | 192.869 |
| 3 | 10270084 | 0.495626 | 3.00109e-05 | 188.509 | 10270079 | 0.00000 | 0.495656 | 191.610 |