| Red | Green | Blue | |
| z | 17.64 | ||
| znorm | Inf | ||
| sky | -Inf | -NaN | -Inf |
| S/N | 17.8 | 33.0 | 36.3 |
| S/N(c) | 0.0 | 0.0 | 0.0 |
| SN(E/C) |
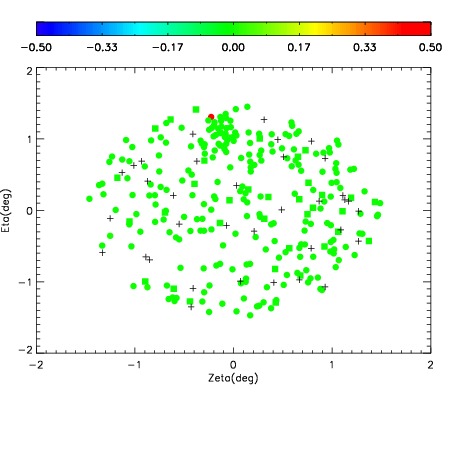
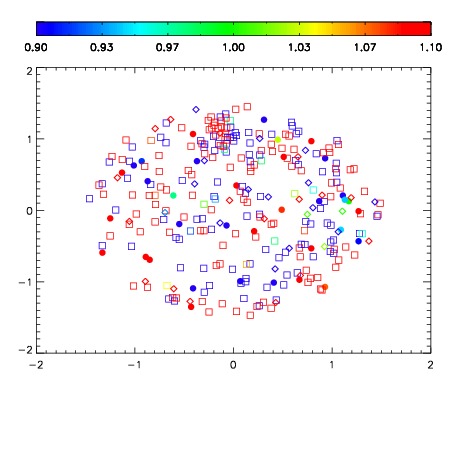
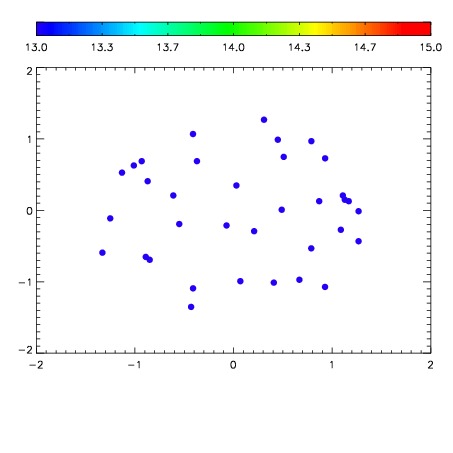

| Frame | Nreads | Zeropoints | Mag plots | Spatial mag deviation | Spatial sky 16325A emission deviations (filled: sky, open: star) | Spatial sky continuum emission | Spatial sky telluric CO2 absorption deviations (filled: H < 10) | |||||||||||||||||||||||
| 0 | 0 |
|
|
|
|
|
|
| IPAIR | NAME | SHIFT | NEWSHIFT | S/N | NAME | SHIFT | NEWSHIFT | S/N |
| 0 | 10790071 | 0.495590 | 0.00000 | 186.467 | 10790076 | -0.00127700 | 0.496867 | 182.601 |
| 1 | 10790075 | 0.495275 | 0.000315011 | 186.556 | 10790072 | -0.00128568 | 0.496876 | 201.513 |
| 2 | 10790070 | 0.494873 | 0.000717014 | 183.114 | 10790073 | -0.00117744 | 0.496767 | 180.346 |
| 3 | 10790074 | 0.494478 | 0.00111201 | 173.959 | 10790069 | 0.00000 | 0.495590 | 179.776 |