| Red | Green | Blue | |
| z | 17.64 | ||
| znorm | Inf | ||
| sky | -Inf | -Inf | -Inf |
| S/N | 20.7 | 36.0 | 38.6 |
| S/N(c) | 0.0 | 0.0 | 0.0 |
| SN(E/C) |
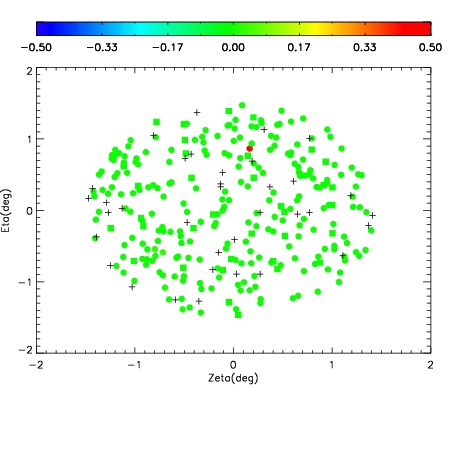
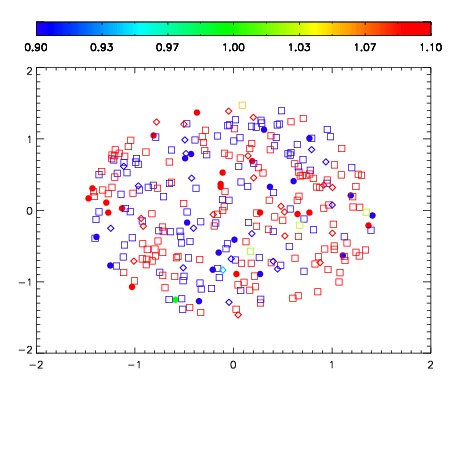
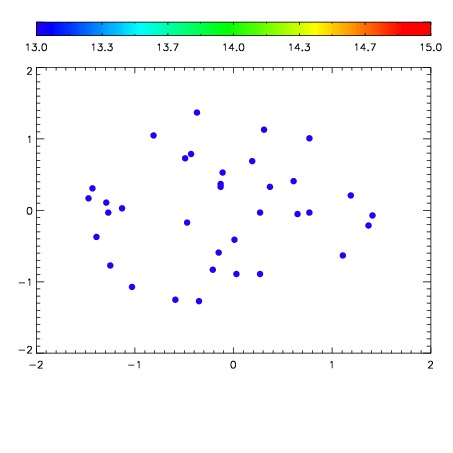

| Frame | Nreads | Zeropoints | Mag plots | Spatial mag deviation | Spatial sky 16325A emission deviations (filled: sky, open: star) | Spatial sky continuum emission | Spatial sky telluric CO2 absorption deviations (filled: H < 10) | |||||||||||||||||||||||
| 0 | 0 |
|
|
|
|
|
|
| IPAIR | NAME | SHIFT | NEWSHIFT | S/N | NAME | SHIFT | NEWSHIFT | S/N |
| 0 | 10830012 | 0.493270 | 0.00000 | 179.350 | 10830018 | -0.00157863 | 0.494849 | 177.532 |
| 1 | 10830013 | 0.492549 | 0.000721008 | 201.489 | 10830011 | 0.00000 | 0.493270 | 206.445 |
| 2 | 10830017 | 0.491961 | 0.00130901 | 189.991 | 10830015 | -0.00234414 | 0.495614 | 206.371 |
| 3 | 10830016 | 0.492563 | 0.000707000 | 178.247 | 10830014 | -0.00291405 | 0.496184 | 163.254 |