| Red | Green | Blue | |
| z | 17.64 | ||
| znorm | Inf | ||
| sky | -Inf | -Inf | -Inf |
| S/N | 32.0 | 55.7 | 61.3 |
| S/N(c) | 0.0 | 0.0 | 0.0 |
| SN(E/C) |
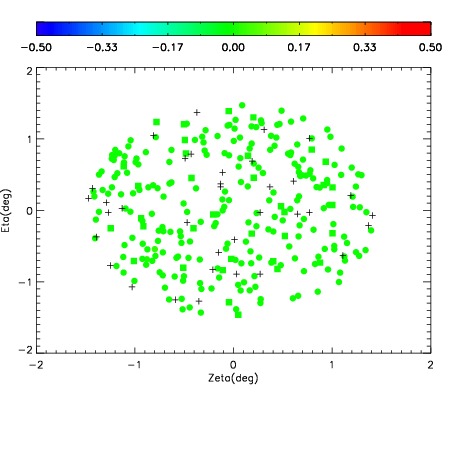
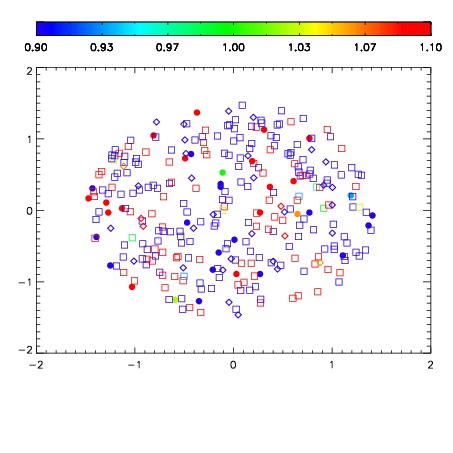
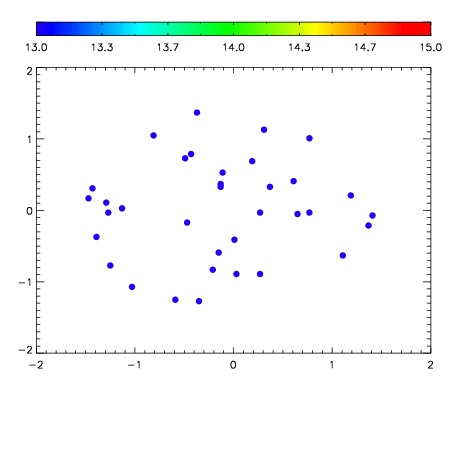

| Frame | Nreads | Zeropoints | Mag plots | Spatial mag deviation | Spatial sky 16325A emission deviations (filled: sky, open: star) | Spatial sky continuum emission | Spatial sky telluric CO2 absorption deviations (filled: H < 10) | |||||||||||||||||||||||
| 0 | 0 |
|
|
|
|
|
|
| IPAIR | NAME | SHIFT | NEWSHIFT | S/N | NAME | SHIFT | NEWSHIFT | S/N |
| 0 | 11040062 | 0.477225 | 0.00000 | 224.010 | 11040063 | -0.00238909 | 0.479614 | 223.773 |
| 1 | 11040061 | 0.476942 | 0.000283003 | 221.334 | 11040064 | -0.00325298 | 0.480478 | 222.078 |
| 2 | 11040065 | 0.476860 | 0.000365019 | 219.497 | 11040067 | -0.00372184 | 0.480947 | 216.422 |
| 3 | 11040070 | 0.475412 | 0.00181299 | 216.590 | 11040068 | -0.00408907 | 0.481314 | 211.219 |
| 4 | 11040066 | 0.476991 | 0.000234008 | 214.032 | 11040060 | 0.00000 | 0.477225 | 210.579 |
| 5 | 11040069 | 0.475273 | 0.00195199 | 211.218 | 11040071 | -0.00594336 | 0.483168 | 207.198 |