| Red | Green | Blue | |
| z | 17.64 | ||
| znorm | Inf | ||
| sky | -Inf | -Inf | -Inf |
| S/N | 22.8 | 40.4 | 46.5 |
| S/N(c) | 0.0 | 0.0 | 0.0 |
| SN(E/C) |
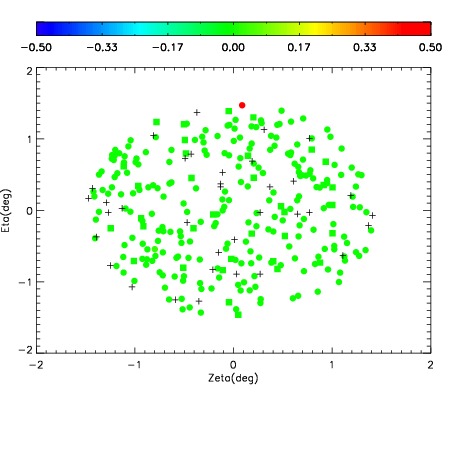
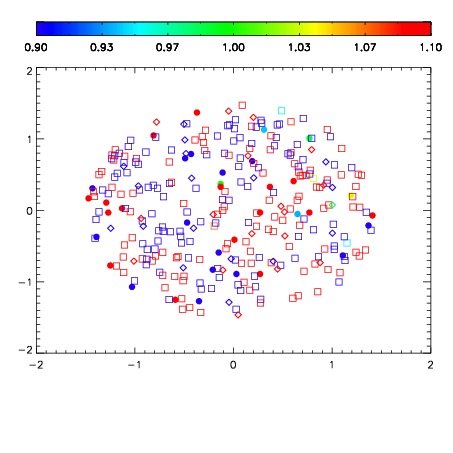
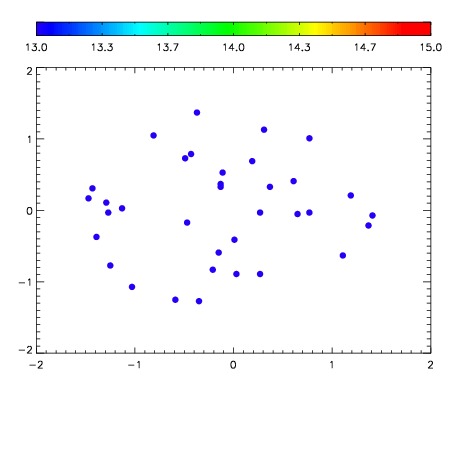

| Frame | Nreads | Zeropoints | Mag plots | Spatial mag deviation | Spatial sky 16325A emission deviations (filled: sky, open: star) | Spatial sky continuum emission | Spatial sky telluric CO2 absorption deviations (filled: H < 10) | |||||||||||||||||||||||
| 0 | 0 |
|
|
|
|
|
|
| IPAIR | NAME | SHIFT | NEWSHIFT | S/N | NAME | SHIFT | NEWSHIFT | S/N |
| 0 | 11090062 | 0.474783 | 0.00000 | 211.072 | 11090064 | -0.00269561 | 0.477479 | 205.016 |
| 1 | 11090061 | 0.474183 | 0.000600010 | 215.893 | 11090060 | 0.00000 | 0.474783 | 212.972 |
| 2 | 11090065 | 0.473758 | 0.00102499 | 205.102 | 11090063 | -0.00262675 | 0.477410 | 203.757 |
| 3 | 11090066 | 0.473337 | 0.00144601 | 203.130 | 11090067 | -0.00467740 | 0.479460 | 199.196 |