| Red | Green | Blue | |
| z | 17.64 | ||
| znorm | Inf | ||
| sky | -Inf | -Inf | -Inf |
| S/N | 22.3 | 39.1 | 41.8 |
| S/N(c) | 0.0 | 0.0 | 0.0 |
| SN(E/C) |
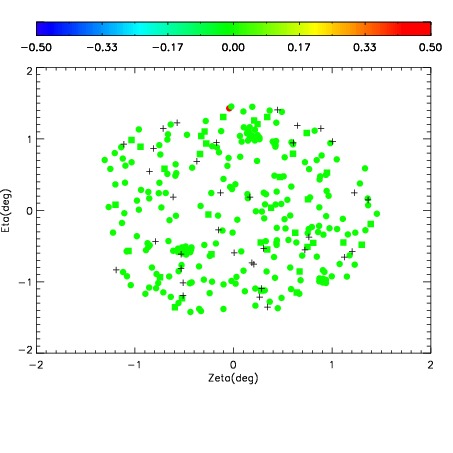
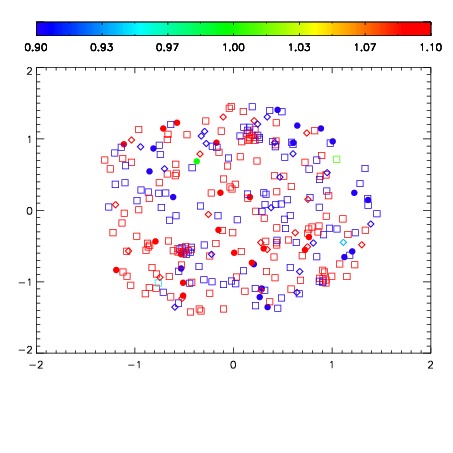
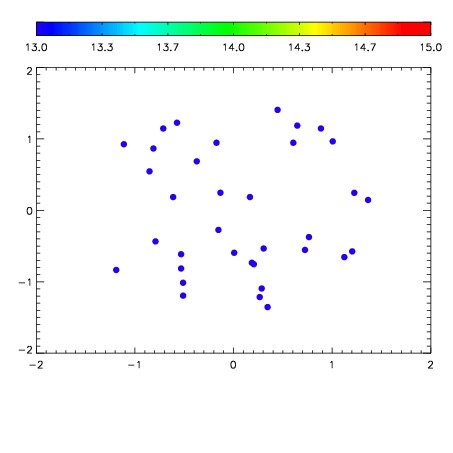

| Frame | Nreads | Zeropoints | Mag plots | Spatial mag deviation | Spatial sky 16325A emission deviations (filled: sky, open: star) | Spatial sky continuum emission | Spatial sky telluric CO2 absorption deviations (filled: H < 10) | |||||||||||||||||||||||
| 0 | 0 |
|
|
|
|
|
|
| IPAIR | NAME | SHIFT | NEWSHIFT | S/N | NAME | SHIFT | NEWSHIFT | S/N |
| 0 | 07840032 | 0.473324 | 0.00000 | 202.100 | 07840026 | 0.00000 | 0.473324 | 200.596 |
| 1 | 07840031 | 0.472872 | 0.000452012 | 211.039 | 07840030 | -0.00195695 | 0.475281 | 203.292 |
| 2 | 07840028 | 0.472074 | 0.00125000 | 197.017 | 07840029 | -0.00318953 | 0.476514 | 200.055 |
| 3 | 07840027 | 0.471917 | 0.00140700 | 194.407 | 07840033 | 0.000710754 | 0.472613 | 195.895 |