| Red | Green | Blue | |
| z | 17.64 | ||
| znorm | Inf | ||
| sky | -Inf | -Inf | -Inf |
| S/N | 27.4 | 48.1 | 52.0 |
| S/N(c) | 0.0 | 0.0 | 0.0 |
| SN(E/C) |
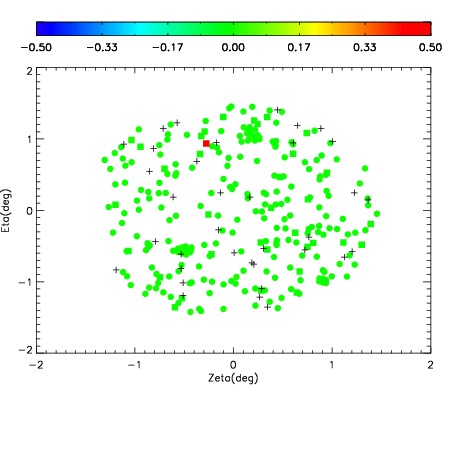
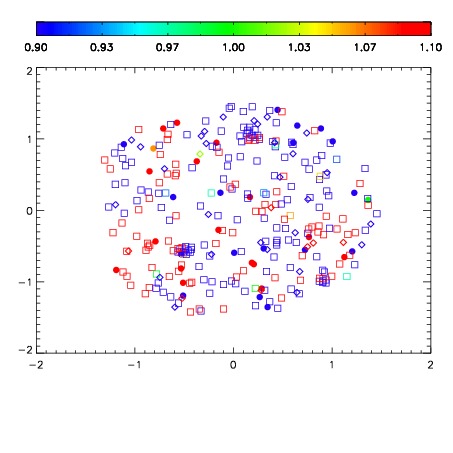
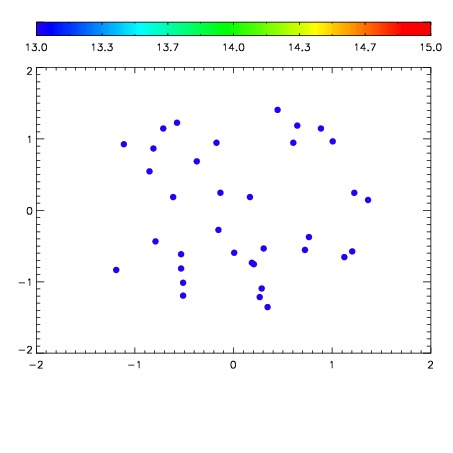

| Frame | Nreads | Zeropoints | Mag plots | Spatial mag deviation | Spatial sky 16325A emission deviations (filled: sky, open: star) | Spatial sky continuum emission | Spatial sky telluric CO2 absorption deviations (filled: H < 10) | |||||||||||||||||||||||
| 0 | 0 |
|
|
|
|
|
|
| IPAIR | NAME | SHIFT | NEWSHIFT | S/N | NAME | SHIFT | NEWSHIFT | S/N |
| 0 | 10240098 | 0.496688 | 0.00000 | 226.188 | 10240099 | 0.000309087 | 0.496379 | 228.025 |
| 1 | 10240093 | 0.495081 | 0.00160700 | 219.904 | 10240092 | 0.00000 | 0.496688 | 222.350 |
| 2 | 10240097 | 0.496012 | 0.000676006 | 217.966 | 10240096 | -0.000565371 | 0.497253 | 218.784 |
| 3 | 10240094 | 0.494686 | 0.00200200 | 216.231 | 10240095 | -2.83821e-05 | 0.496716 | 216.614 |