| Red | Green | Blue | |
| z | 17.64 | ||
| znorm | Inf | ||
| sky | -NaN | -Inf | -Inf |
| S/N | 30.1 | 49.7 | 58.7 |
| S/N(c) | 0.0 | 0.0 | 0.0 |
| SN(E/C) |

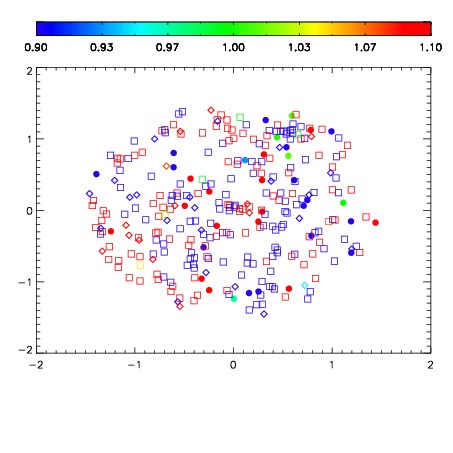
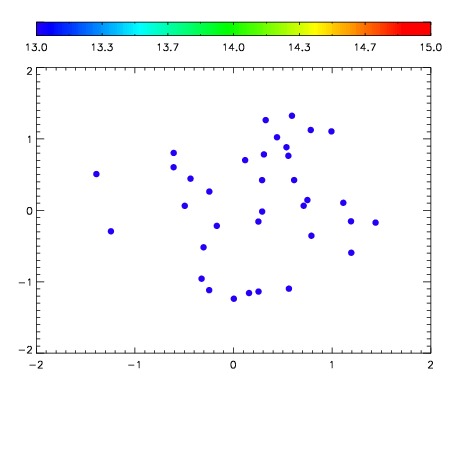

| Frame | Nreads | Zeropoints | Mag plots | Spatial mag deviation | Spatial sky 16325A emission deviations (filled: sky, open: star) | Spatial sky continuum emission | Spatial sky telluric CO2 absorption deviations (filled: H < 10) | |||||||||||||||||||||||
| 0 | 0 |
|
|
|
|
|
|
| IPAIR | NAME | SHIFT | NEWSHIFT | S/N | NAME | SHIFT | NEWSHIFT | S/N |
| 0 | 06930075 | 0.492006 | 0.00000 | 224.323 | 06930077 | 0.000578670 | 0.491427 | 221.476 |
| 1 | 06930074 | 0.490503 | 0.00150299 | 231.548 | 06930073 | 0.00000 | 0.492006 | 229.283 |
| 2 | 06930078 | 0.490448 | 0.00155801 | 225.069 | 06930080 | 0.00145106 | 0.490555 | 227.429 |
| 3 | 06930079 | 0.491650 | 0.000356019 | 214.250 | 06930076 | 0.00168862 | 0.490317 | 218.965 |