| Red | Green | Blue | |
| z | 17.64 | ||
| znorm | Inf | ||
| sky | -Inf | -Inf | -Inf |
| S/N | 34.5 | 54.9 | 66.3 |
| S/N(c) | 0.0 | 0.0 | 0.0 |
| SN(E/C) |
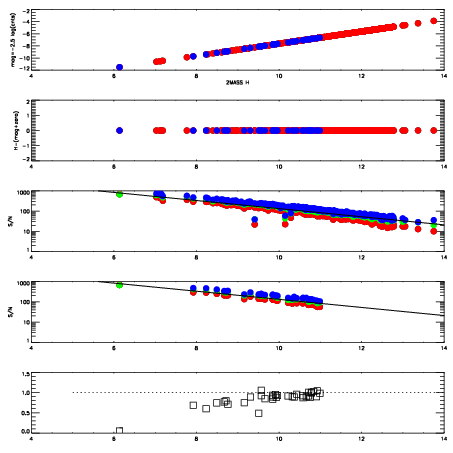
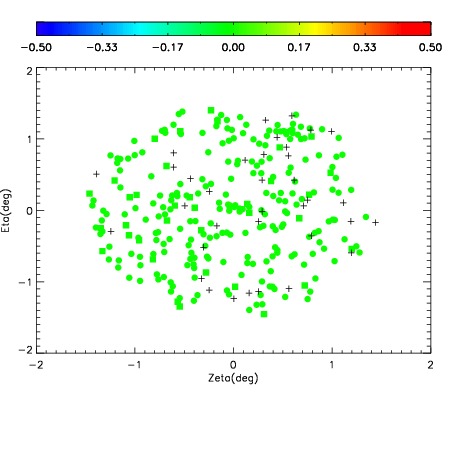
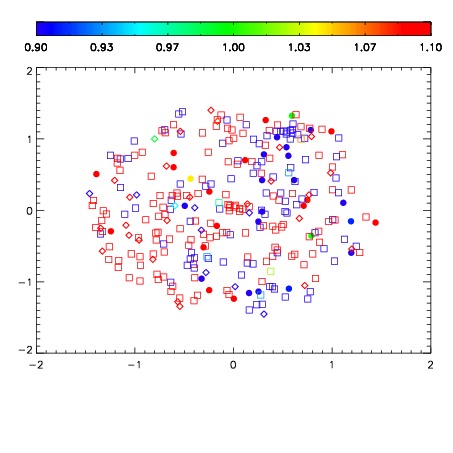
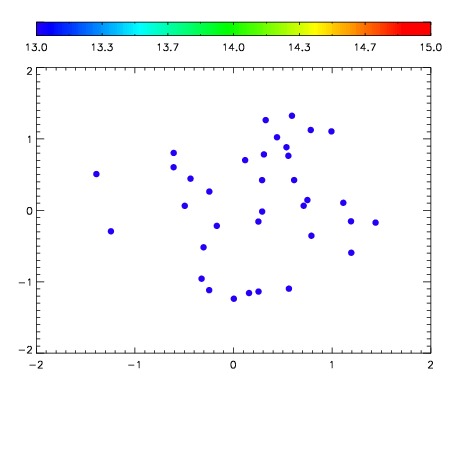

| Frame | Nreads | Zeropoints | Mag plots | Spatial mag deviation | Spatial sky 16325A emission deviations (filled: sky, open: star) | Spatial sky continuum emission | Spatial sky telluric CO2 absorption deviations (filled: H < 10) | |||||||||||||||||||||||
| 0 | 0 |
|
|
|
|
|
|
| IPAIR | NAME | SHIFT | NEWSHIFT | S/N | NAME | SHIFT | NEWSHIFT | S/N |
| 0 | 06980076 | 0.487162 | 0.00000 | 232.809 | 06980077 | 0.00302167 | 0.484140 | 232.305 |
| 1 | 06980075 | 0.485948 | 0.00121400 | 231.487 | 06980078 | 0.00234629 | 0.484816 | 231.740 |
| 2 | 06980072 | 0.483531 | 0.00363100 | 231.395 | 06980073 | 0.00162958 | 0.485532 | 231.359 |
| 3 | 06980071 | 0.482977 | 0.00418499 | 230.788 | 06980074 | 0.00229875 | 0.484863 | 231.086 |
| 4 | 06980079 | 0.482012 | 0.00514999 | 230.062 | 06980070 | 0.00000 | 0.487162 | 229.518 |