| Red | Green | Blue | |
| z | 17.64 | ||
| znorm | Inf | ||
| sky | -Inf | -Inf | -Inf |
| S/N | 21.5 | 37.5 | 45.7 |
| S/N(c) | 0.0 | 0.0 | 0.0 |
| SN(E/C) |

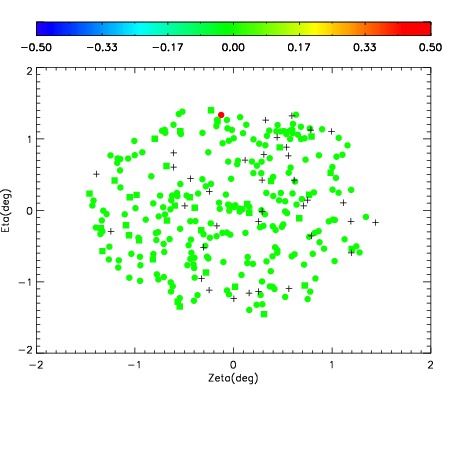
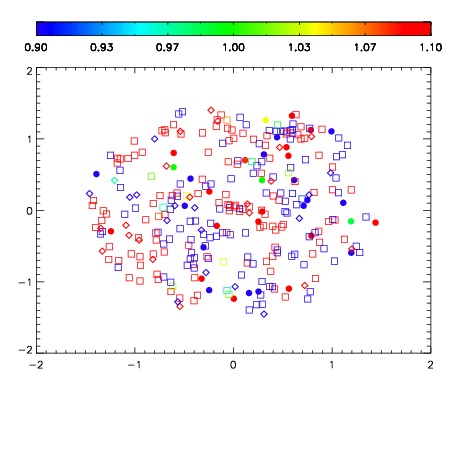
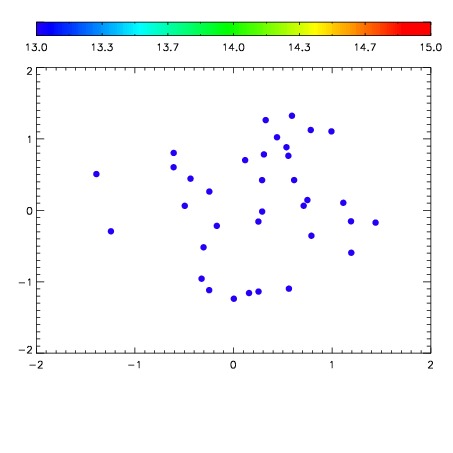

| Frame | Nreads | Zeropoints | Mag plots | Spatial mag deviation | Spatial sky 16325A emission deviations (filled: sky, open: star) | Spatial sky continuum emission | Spatial sky telluric CO2 absorption deviations (filled: H < 10) | |||||||||||||||||||||||
| 0 | 0 |
|
|
|
|
|
|
| IPAIR | NAME | SHIFT | NEWSHIFT | S/N | NAME | SHIFT | NEWSHIFT | S/N |
| 0 | 07200065 | 0.481804 | 0.00000 | 185.201 | 07200063 | 0.000389840 | 0.481414 | 179.376 |
| 1 | 07200064 | 0.480713 | 0.00109100 | 180.329 | 07200066 | 0.00354623 | 0.478258 | 179.214 |
| 2 | 07200060 | 0.477529 | 0.00427502 | 174.838 | 07200059 | 0.00000 | 0.481804 | 173.427 |
| 3 | 07200061 | 0.477989 | 0.00381503 | 173.197 | 07200062 | 0.00495820 | 0.476846 | 168.140 |