| Red | Green | Blue | |
| z | 17.64 | ||
| znorm | Inf | ||
| sky | -NaN | -Inf | -Inf |
| S/N | 30.5 | 54.4 | 62.4 |
| S/N(c) | 0.0 | 0.0 | 0.0 |
| SN(E/C) |
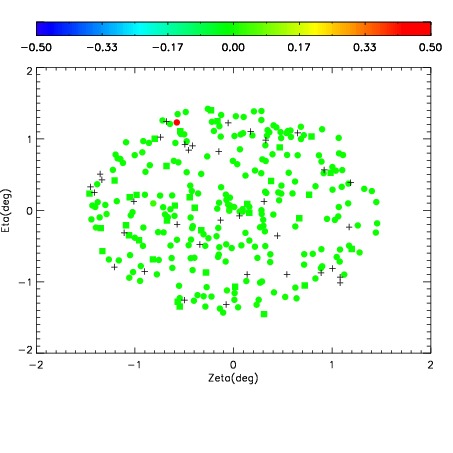
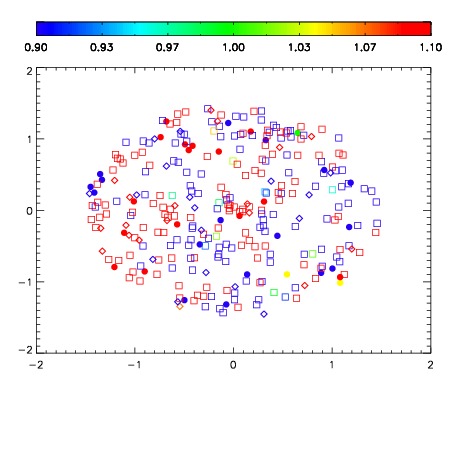
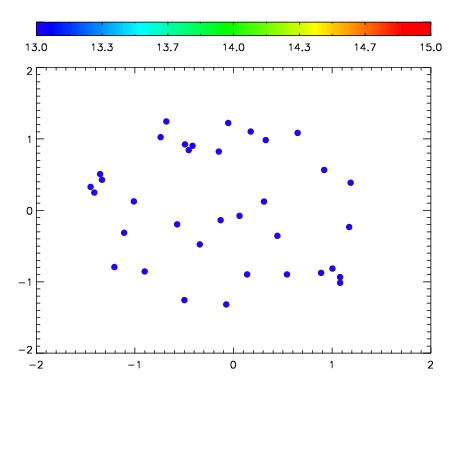

| Frame | Nreads | Zeropoints | Mag plots | Spatial mag deviation | Spatial sky 16325A emission deviations (filled: sky, open: star) | Spatial sky continuum emission | Spatial sky telluric CO2 absorption deviations (filled: H < 10) | |||||||||||||||||||||||
| 0 | 0 |
|
|
|
|
|
|
| IPAIR | NAME | SHIFT | NEWSHIFT | S/N | NAME | SHIFT | NEWSHIFT | S/N |
| 0 | 06940074 | 0.497237 | 0.00000 | 178.682 | 06940083 | -0.00135127 | 0.498588 | 174.879 |
| 1 | 06940078 | 0.495403 | 0.00183401 | 180.654 | 06940076 | -0.00147064 | 0.498708 | 176.462 |
| 2 | 06940082 | 0.494229 | 0.00300801 | 175.975 | 06940079 | -0.00136175 | 0.498599 | 174.319 |
| 3 | 06940081 | 0.494017 | 0.00321999 | 173.717 | 06940080 | 0.000505411 | 0.496732 | 172.656 |
| 4 | 06940077 | 0.495126 | 0.00211099 | 170.711 | 06940075 | -0.00169856 | 0.498936 | 171.936 |
| 5 | 06940073 | 0.497206 | 3.09944e-05 | 168.613 | 06940072 | 0.00000 | 0.497237 | 169.872 |