| Red | Green | Blue | |
| z | 17.64 | ||
| znorm | Inf | ||
| sky | -Inf | -Inf | -Inf |
| S/N | 33.3 | 54.9 | 62.9 |
| S/N(c) | 0.0 | 0.0 | 0.0 |
| SN(E/C) |
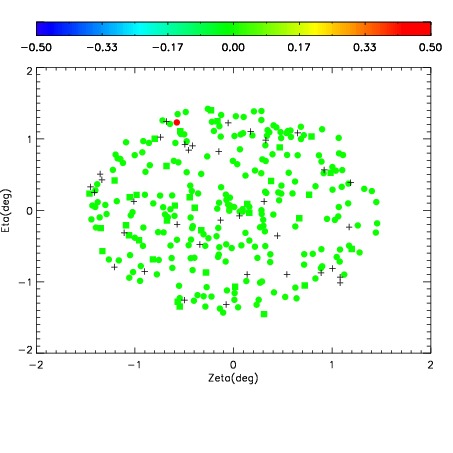
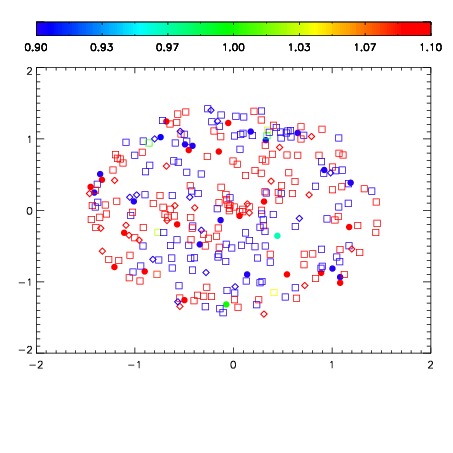


| Frame | Nreads | Zeropoints | Mag plots | Spatial mag deviation | Spatial sky 16325A emission deviations (filled: sky, open: star) | Spatial sky continuum emission | Spatial sky telluric CO2 absorption deviations (filled: H < 10) | |||||||||||||||||||||||
| 0 | 0 |
|
|
|
|
|
|
| IPAIR | NAME | SHIFT | NEWSHIFT | S/N | NAME | SHIFT | NEWSHIFT | S/N |
| 0 | 06990066 | 0.484343 | 0.00000 | 180.063 | 06990068 | -0.00128073 | 0.485624 | 178.338 |
| 1 | 06990065 | 0.478720 | 0.00562298 | 181.298 | 06990071 | -0.000319984 | 0.484663 | 178.374 |
| 2 | 06990069 | 0.479026 | 0.00531700 | 179.705 | 06990067 | -0.000138067 | 0.484481 | 176.382 |
| 3 | 06990070 | 0.482382 | 0.00196099 | 176.997 | 06990072 | 0.000755906 | 0.483587 | 175.643 |
| 4 | 06990073 | 0.479684 | 0.00465900 | 173.035 | 06990064 | 0.00000 | 0.484343 | 174.003 |