| Frame | Nreads | Zeropoints | Mag plots
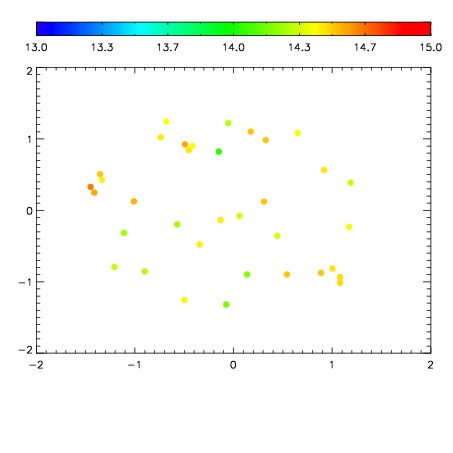
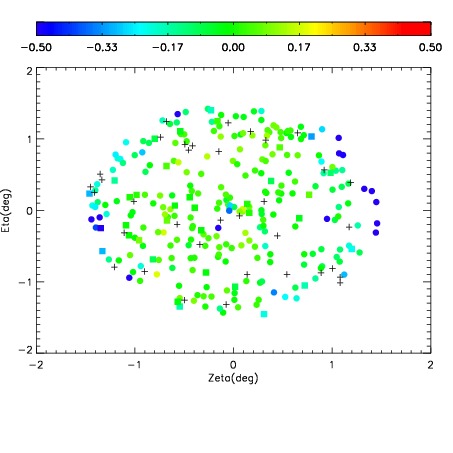
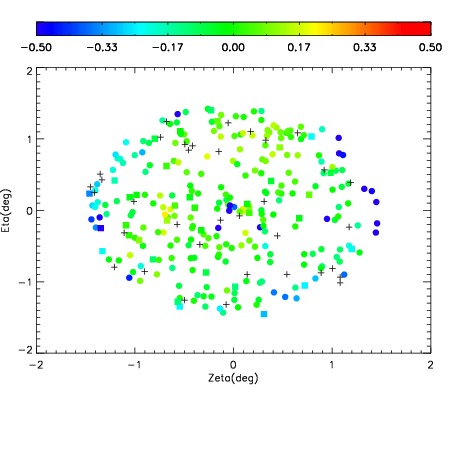
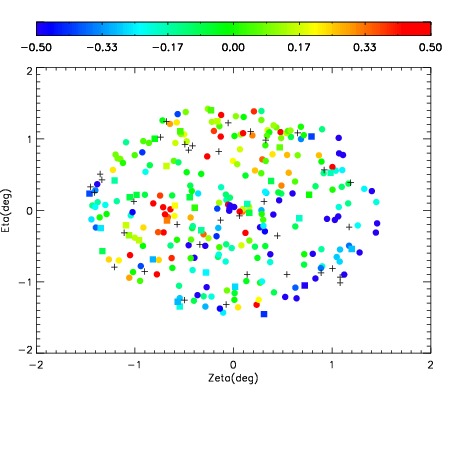
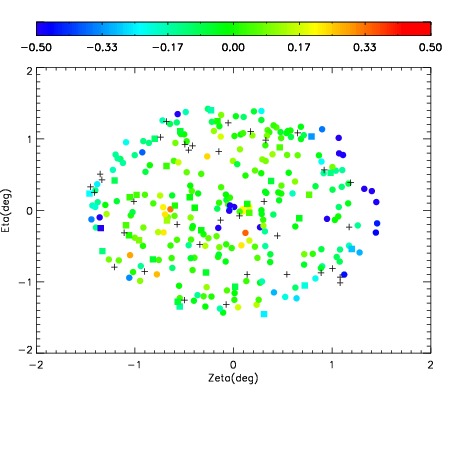
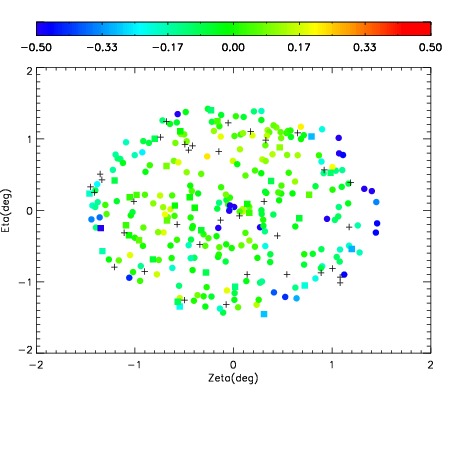
| Spatial mag deviation
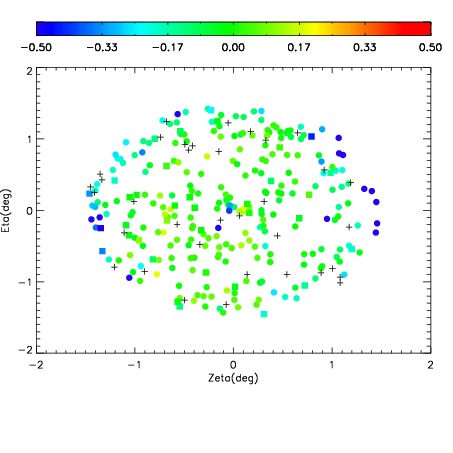
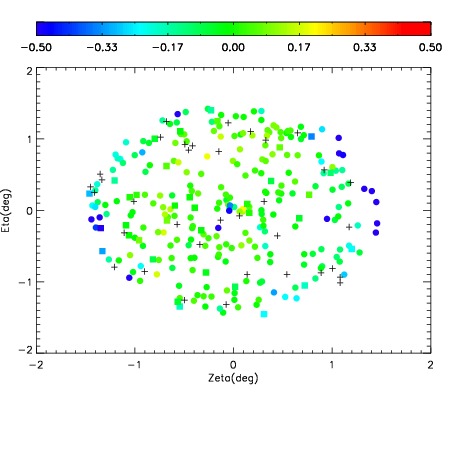
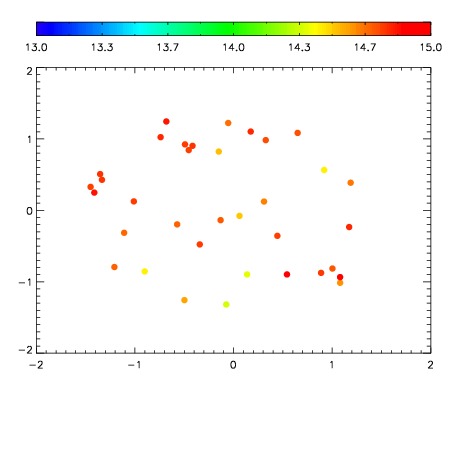
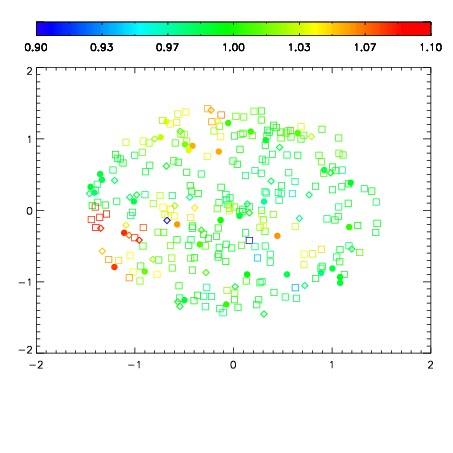
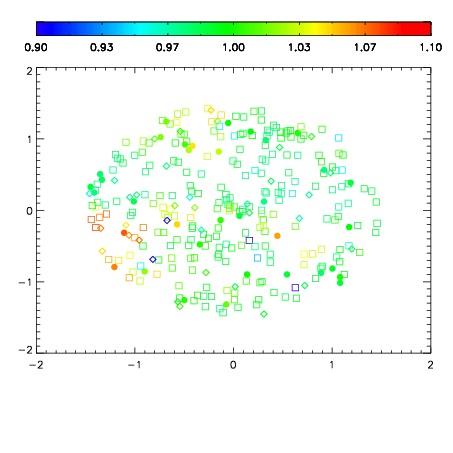
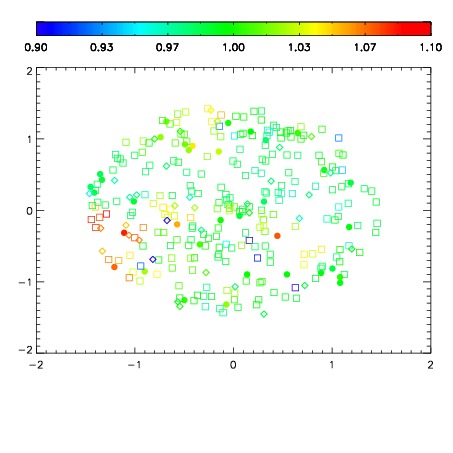
| Spatial sky 16325A emission deviations (filled: sky, open: star)
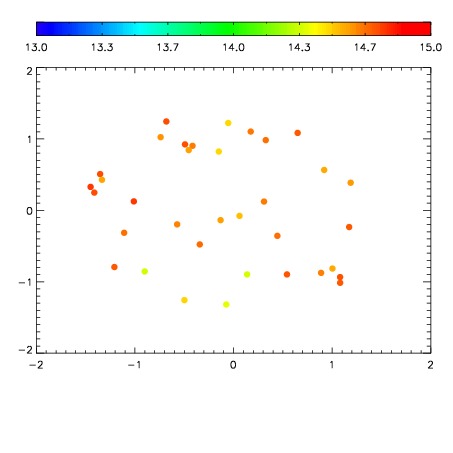
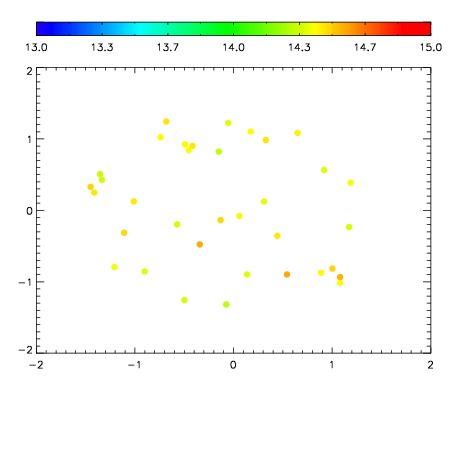
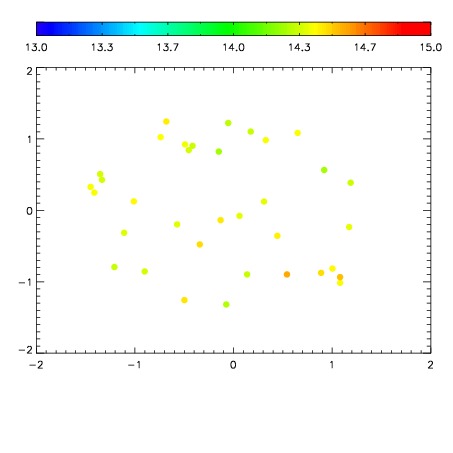
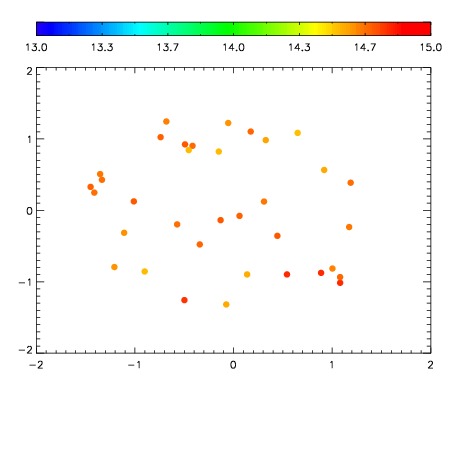
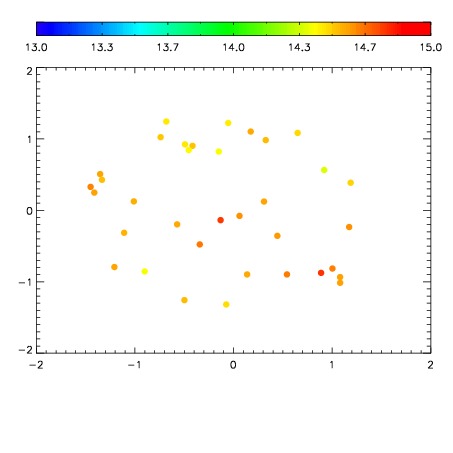
| Spatial sky continuum emission
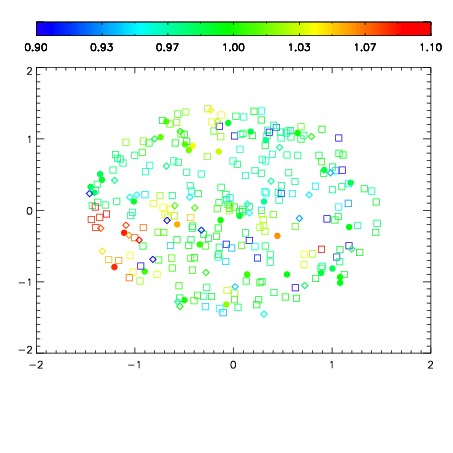
| Spatial sky telluric CO2 absorption deviations (filled: H < 10)
|
| 7210059
| 47
| | Red | Green | Blue
| | z | | 18.41
| | znorm | | 14.23
| | sky | 14.7 | 14.4 | 14.3
| | S/N | 9.4 | 17.6 | 19.8
| | S/N(c) | 8.3 | 16.4 | 18.9
| | SN(E/C) 0.96
|
| 
| 
| 
| 
| 
|
| 7210060
| 47
| | Red | Green | Blue
| | z | | 18.17
| | znorm | | 13.99
| | sky | 14.6 | 14.4 | 14.8
| | S/N | 7.9 | 15.1 | 18.0
| | S/N(c) | 7.0 | 14.1 | 16.7
| | SN(E/C) 0.92
|
| 
| 
| 
| 
| 
|
| 7210061
| 47
| | Red | Green | Blue
| | z | | 18.54
| | znorm | | 14.36
| | sky | 14.8 | 14.7 | 14.9
| | S/N | 10.5 | 19.0 | 21.8
| | S/N(c) | 9.1 | 17.8 | 20.1
| | SN(E/C) 0.96
|
| 
| 
| 
| 
| 
|
| 7210062
| 47
| | Red | Green | Blue
| | z | | 18.57
| | znorm | | 14.39
| | sky | 14.9 | 14.7 | 14.8
| | S/N | 10.9 | 19.4 | 22.1
| | S/N(c) | 9.6 | 18.2 | 20.3
| | SN(E/C) 0.97
|
| 
| 
| 
| 
| 
|
| 7210063
| 47
| | Red | Green | Blue
| | z | | 17.20
| | znorm | | 13.02
| | sky | 14.5 | 14.4 | 14.8
| | S/N | 3.6 | 7.7 | 9.2
| | S/N(c) | 3.1 | 7.1 | 8.2
| | SN(E/C) 0.96
|
| 
| 
| 
| 
| 
|
| 7210064
| 47
| | Red | Green | Blue
| | z | | 14.96
| | znorm | | 10.78
| | sky | 14.5 | 14.4 | 15.0
| | S/N | 0.3 | 1.5 | 0.9
| | S/N(c) | 0.0 | 0.0 | 0.0
| | SN(E/C) 1.18
|
| 
| 
| 
| 
| 
|
| 7210065
| 47
| | Red | Green | Blue
| | z | | 16.34
| | znorm | | 12.16
| | sky | 14.7 | 14.7 | 14.9
| | S/N | 1.7 | 4.4 | 4.6
| | S/N(c) | 1.5 | 4.1 | 4.1
| | SN(E/C) 0.98
|
| 
| 
| 
| 
| 
|
| 7210066
| 47
| | Red | Green | Blue
| | z | | 16.80
| | znorm | | 12.62
| | sky | 14.4 | 14.6 | 14.9
| | S/N | 2.5 | 6.2 | 6.7
| | S/N(c) | 2.3 | 5.6 | 6.2
| | SN(E/C) 0.98
|
| 
| 
| 
| 
| 
|