| Red | Green | Blue | |
| z | 17.64 | ||
| znorm | Inf | ||
| sky | -Inf | -Inf | -Inf |
| S/N | 12.1 | 23.9 | 27.6 |
| S/N(c) | 0.0 | 0.0 | 0.0 |
| SN(E/C) |
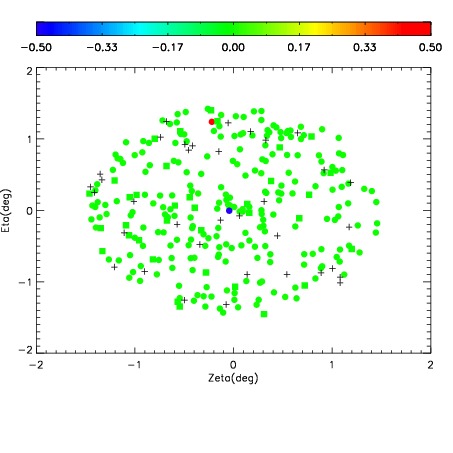
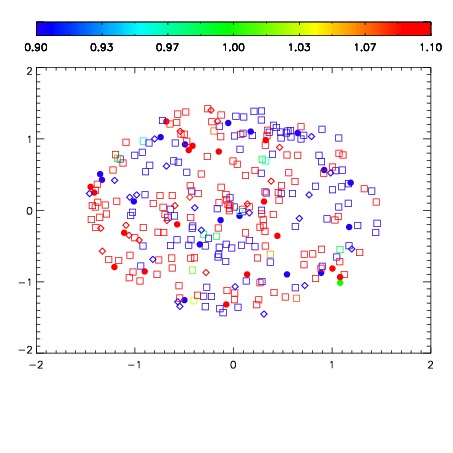


| Frame | Nreads | Zeropoints | Mag plots | Spatial mag deviation | Spatial sky 16325A emission deviations (filled: sky, open: star) | Spatial sky continuum emission | Spatial sky telluric CO2 absorption deviations (filled: H < 10) | |||||||||||||||||||||||
| 0 | 0 |
|
|
|
|
|
|
| IPAIR | NAME | SHIFT | NEWSHIFT | S/N | NAME | SHIFT | NEWSHIFT | S/N |
| 0 | 07210065 | 0.486219 | 0.00000 | 55.1409 | 07210063 | 0.00195008 | 0.484269 | 87.6646 |
| 1 | 07210061 | 0.483940 | 0.00227898 | 161.598 | 07210062 | 0.00156182 | 0.484657 | 163.990 |
| 2 | 07210060 | 0.483770 | 0.00244898 | 137.532 | 07210059 | 0.00000 | 0.486219 | 147.456 |