| Red | Green | Blue | |
| z | 17.64 | ||
| znorm | Inf | ||
| sky | -Inf | -Inf | -Inf |
| S/N | 28.8 | 48.4 | 53.4 |
| S/N(c) | 0.0 | 0.0 | 0.0 |
| SN(E/C) |
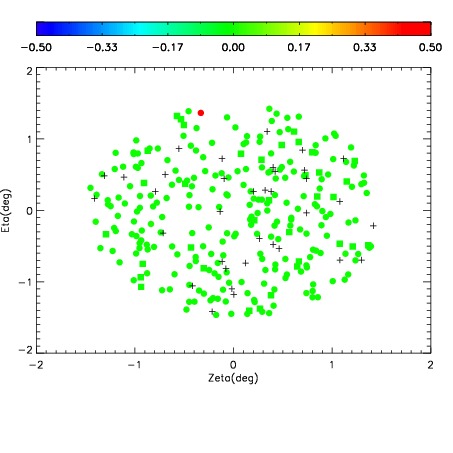

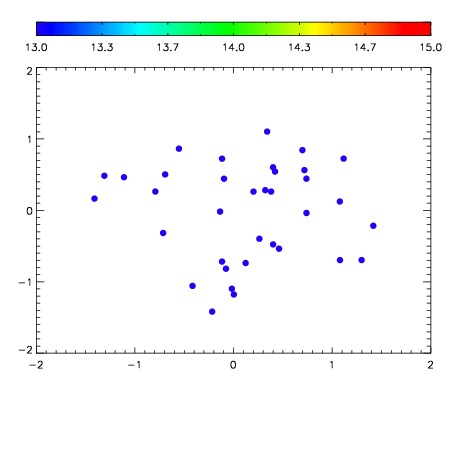

| Frame | Nreads | Zeropoints | Mag plots | Spatial mag deviation | Spatial sky 16325A emission deviations (filled: sky, open: star) | Spatial sky continuum emission | Spatial sky telluric CO2 absorption deviations (filled: H < 10) | |||||||||||||||||||||||
| 0 | 0 |
|
|
|
|
|
|
| IPAIR | NAME | SHIFT | NEWSHIFT | S/N | NAME | SHIFT | NEWSHIFT | S/N |
| 0 | 10440031 | 0.502251 | 0.00000 | 173.652 | 10440032 | 0.00249643 | 0.499755 | 175.624 |
| 1 | 10440026 | 0.500617 | 0.00163400 | 171.903 | 10440028 | 0.00101842 | 0.501233 | 171.007 |
| 2 | 10440030 | 0.501730 | 0.000521004 | 168.995 | 10440029 | 0.000898912 | 0.501352 | 168.931 |
| 3 | 10440027 | 0.500745 | 0.00150603 | 167.998 | 10440025 | 0.00000 | 0.502251 | 164.567 |