| Red | Green | Blue | |
| z | 17.64 | ||
| znorm | Inf | ||
| sky | -Inf | -Inf | -Inf |
| S/N | 20.3 | 35.9 | 39.0 |
| S/N(c) | 0.0 | 0.0 | 0.0 |
| SN(E/C) |


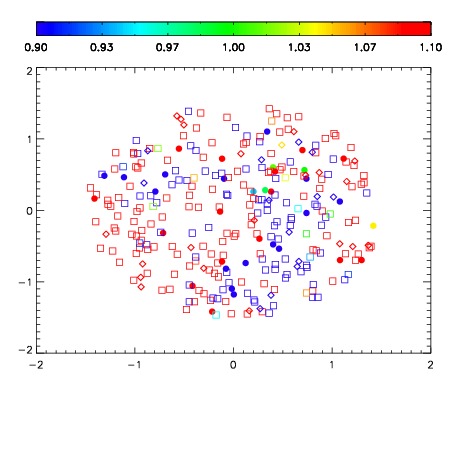
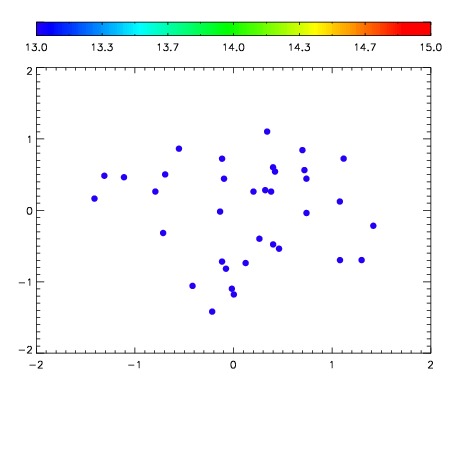

| Frame | Nreads | Zeropoints | Mag plots | Spatial mag deviation | Spatial sky 16325A emission deviations (filled: sky, open: star) | Spatial sky continuum emission | Spatial sky telluric CO2 absorption deviations (filled: H < 10) | |||||||||||||||||||||||
| 0 | 0 |
|
|
|
|
|
|
| IPAIR | NAME | SHIFT | NEWSHIFT | S/N | NAME | SHIFT | NEWSHIFT | S/N |
| 0 | 10660013 | 0.513743 | 0.00000 | 121.769 | 10660011 | 0.00000 | 0.513743 | 134.882 |
| 1 | 10660016 | 0.511549 | 0.00219399 | 144.135 | 10660014 | 0.00306431 | 0.510679 | 141.730 |
| 2 | 10660012 | 0.513562 | 0.000180960 | 126.654 | 10660015 | 0.00235090 | 0.511392 | 135.734 |
| 3 | 10660017 | 0.512510 | 0.00123298 | 100.823 | 10660018 | 0.00136514 | 0.512378 | 121.267 |