| Red | Green | Blue | |
| z | 17.64 | ||
| znorm | Inf | ||
| sky | -Inf | -Inf | -Inf |
| S/N | 28.7 | 47.4 | 51.1 |
| S/N(c) | 0.0 | 0.0 | 0.0 |
| SN(E/C) |
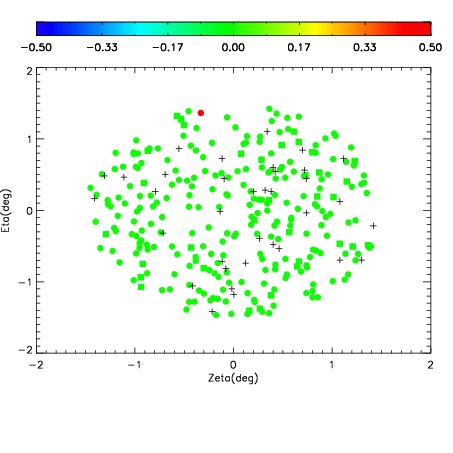
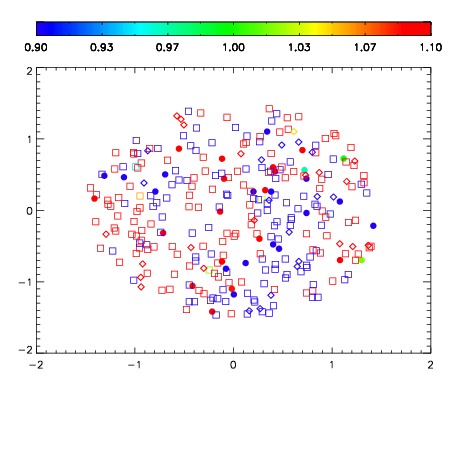
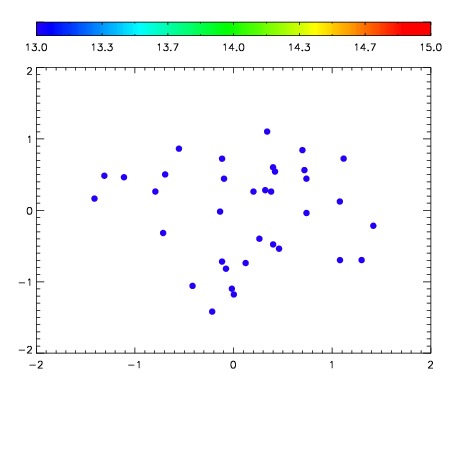

| Frame | Nreads | Zeropoints | Mag plots | Spatial mag deviation | Spatial sky 16325A emission deviations (filled: sky, open: star) | Spatial sky continuum emission | Spatial sky telluric CO2 absorption deviations (filled: H < 10) | |||||||||||||||||||||||
| 0 | 0 |
|
|
|
|
|
|
| IPAIR | NAME | SHIFT | NEWSHIFT | S/N | NAME | SHIFT | NEWSHIFT | S/N |
| 0 | 10750012 | 0.494090 | 0.00000 | 149.791 | 10750011 | 0.00000 | 0.494090 | 150.778 |
| 1 | 10750017 | 0.490243 | 0.00384700 | 157.271 | 10750018 | -0.00177678 | 0.495867 | 158.069 |
| 2 | 10750016 | 0.489871 | 0.00421900 | 156.550 | 10750014 | -0.00222714 | 0.496317 | 154.294 |
| 3 | 10750013 | 0.493799 | 0.000290990 | 149.294 | 10750015 | -0.00206578 | 0.496156 | 148.283 |