| Red | Green | Blue | |
| z | 17.64 | ||
| znorm | Inf | ||
| sky | -Inf | -Inf | -Inf |
| S/N | 31.7 | 53.1 | 59.0 |
| S/N(c) | 0.0 | 0.0 | 0.0 |
| SN(E/C) |
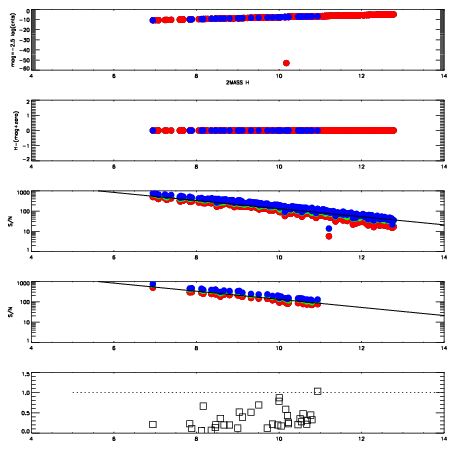


| Frame | Nreads | Zeropoints | Mag plots | Spatial mag deviation | Spatial sky 16325A emission deviations (filled: sky, open: star) | Spatial sky continuum emission | Spatial sky telluric CO2 absorption deviations (filled: H < 10) | |||||||||||||||||||||||
| 0 | 0 |
|
|
|
|
|
|
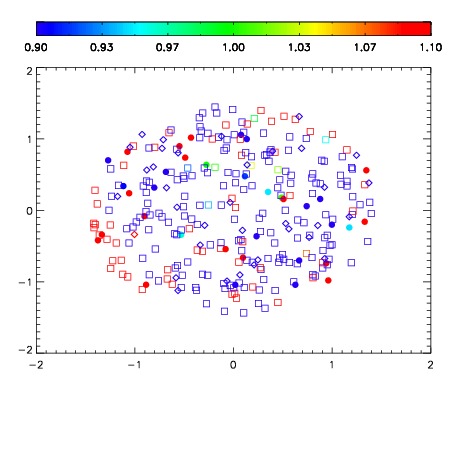
| IPAIR | NAME | SHIFT | NEWSHIFT | S/N | NAME | SHIFT | NEWSHIFT | S/N |
| 0 | 10210057 | 0.491440 | 0.00000 | 205.955 | 10210052 | 0.00648518 | 0.484955 | 205.607 |
| 1 | 10210054 | 0.490912 | 0.000528008 | 206.590 | 10210055 | 0.00341150 | 0.488028 | 205.979 |
| 2 | 10210053 | 0.490415 | 0.00102499 | 205.017 | 10210056 | 0.00377231 | 0.487668 | 205.322 |
| 3 | 10210050 | 0.490235 | 0.00120500 | 202.155 | 10210048 | 0.00000 | 0.491440 | 198.715 |
| 4 | 10210049 | 0.490022 | 0.00141799 | 200.411 | 10210051 | 0.00708945 | 0.484351 | 195.598 |