| Red | Green | Blue | |
| z | 17.64 | ||
| znorm | Inf | ||
| sky | -Inf | -Inf | -Inf |
| S/N | 29.3 | 49.9 | 55.6 |
| S/N(c) | 0.0 | 0.0 | 0.0 |
| SN(E/C) |
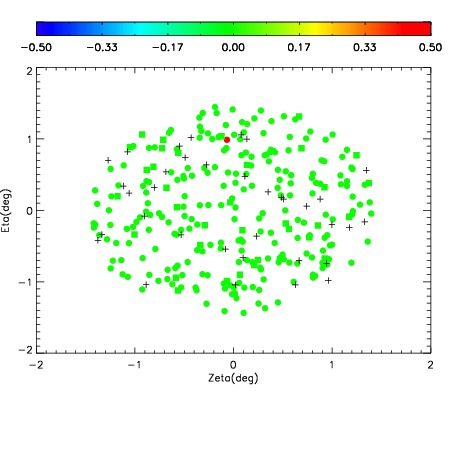
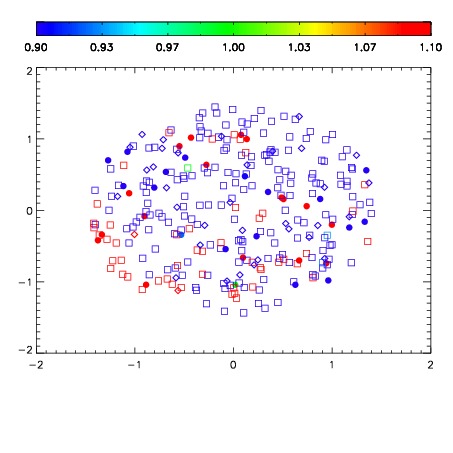
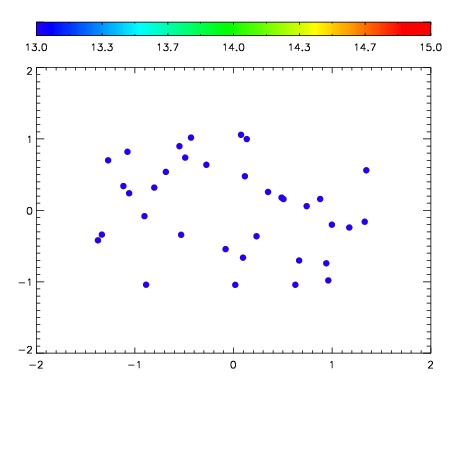

| Frame | Nreads | Zeropoints | Mag plots | Spatial mag deviation | Spatial sky 16325A emission deviations (filled: sky, open: star) | Spatial sky continuum emission | Spatial sky telluric CO2 absorption deviations (filled: H < 10) | |||||||||||||||||||||||
| 0 | 0 |
|
|
|
|
|
|
| IPAIR | NAME | SHIFT | NEWSHIFT | S/N | NAME | SHIFT | NEWSHIFT | S/N |
| 0 | 10440042 | 0.500633 | 0.00000 | 191.211 | 10440043 | -0.00371832 | 0.504351 | 194.650 |
| 1 | 10440041 | 0.500320 | 0.000312984 | 189.668 | 10440040 | -0.00272190 | 0.503355 | 191.291 |
| 2 | 10440037 | 0.499837 | 0.000795990 | 189.356 | 10440039 | -0.00321063 | 0.503844 | 185.791 |
| 3 | 10440038 | 0.500400 | 0.000232995 | 187.633 | 10440036 | 0.00000 | 0.500633 | 182.196 |