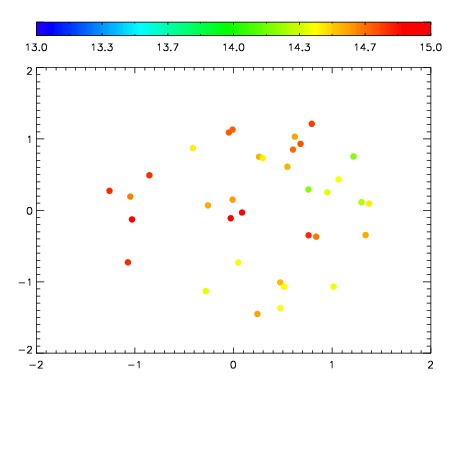
| Frame | Nreads | Zeropoints | Mag plots
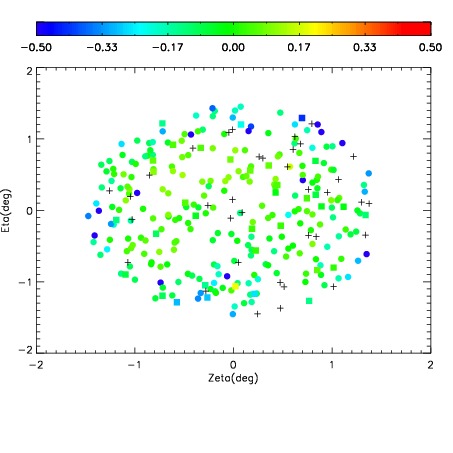
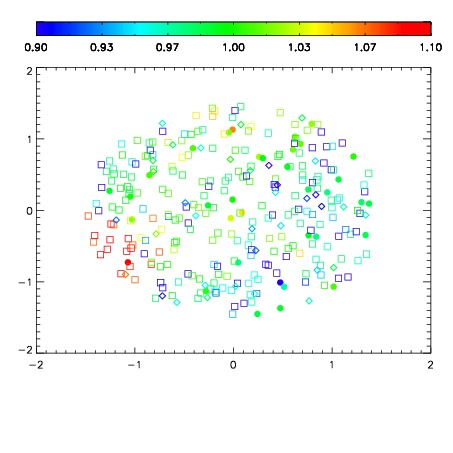
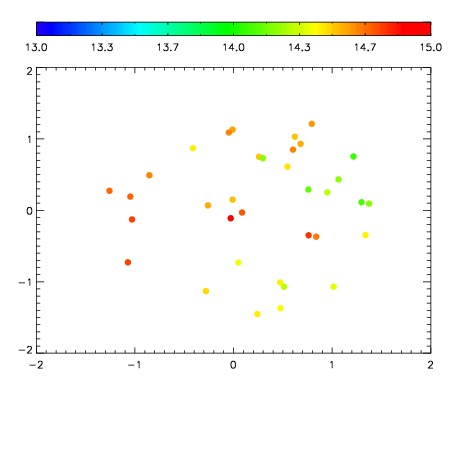
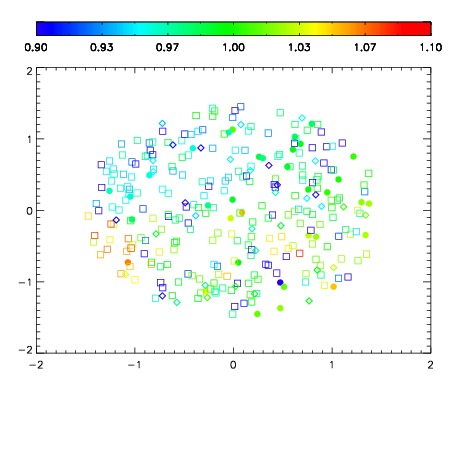
| Spatial mag deviation
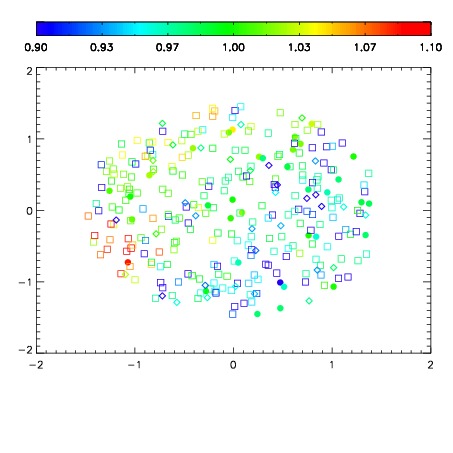
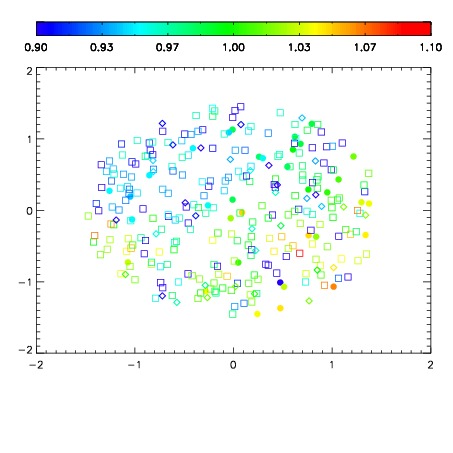
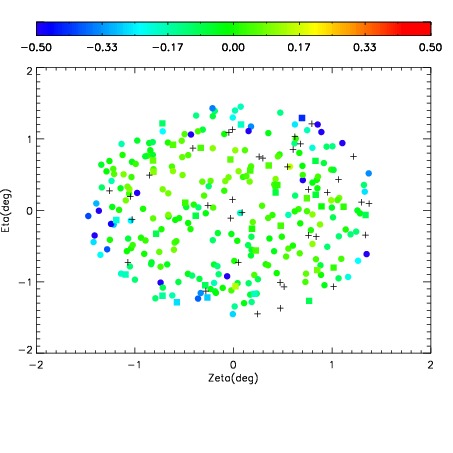
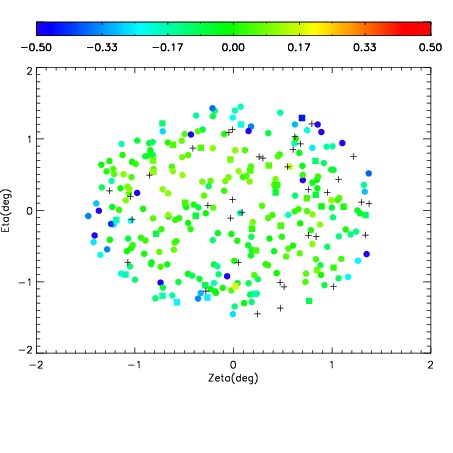
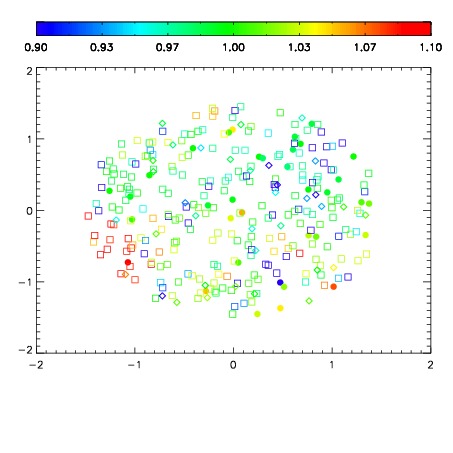
| Spatial sky 16325A emission deviations (filled: sky, open: star)
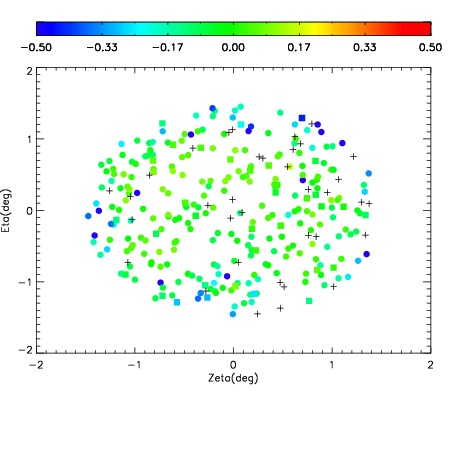
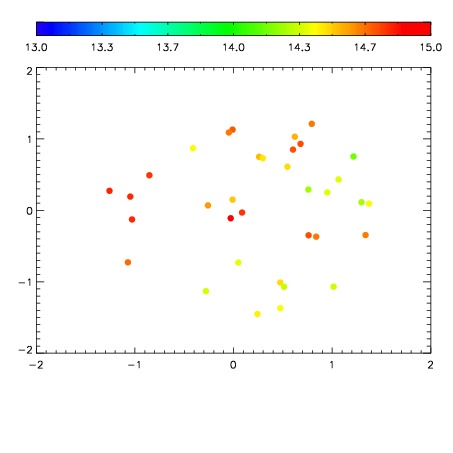
| Spatial sky continuum emission
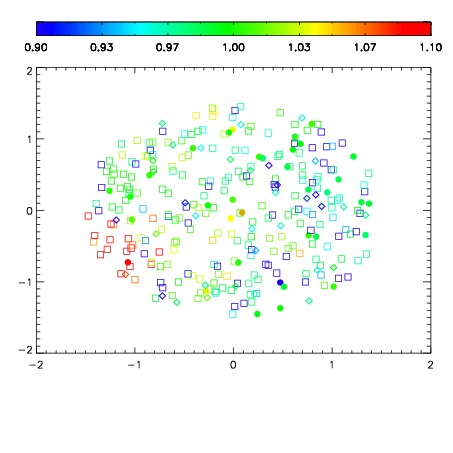
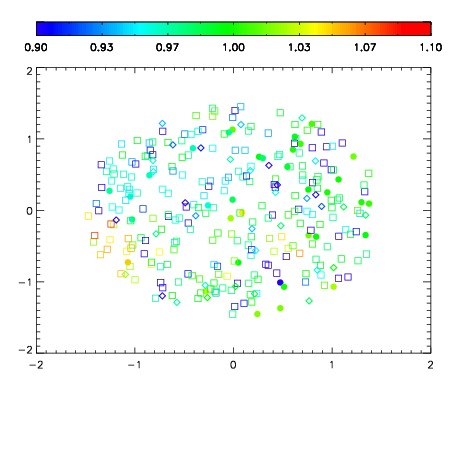
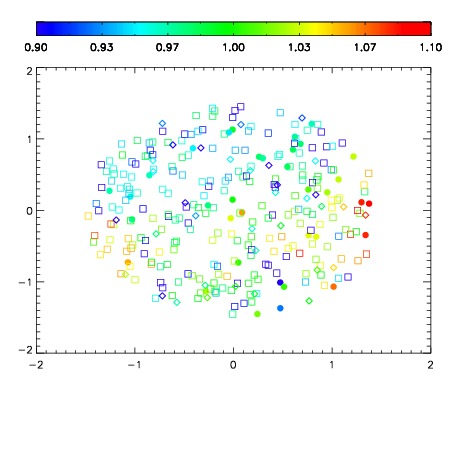
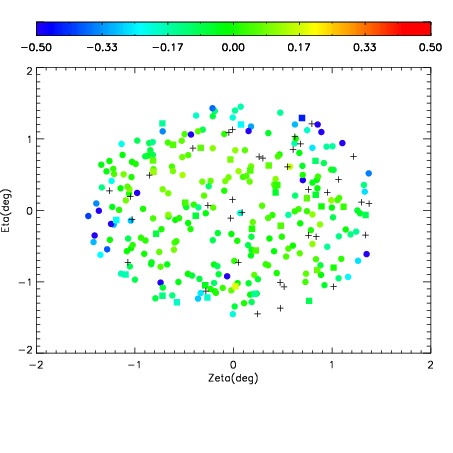
| Spatial sky telluric CO2 absorption deviations (filled: H < 10)
|
| 10220050
| 47
| | Red | Green | Blue
| | z | | 19.22
| | znorm | | 15.04
| | sky | 14.7 | 14.4 | 14.3
| | S/N | 16.9 | 27.3 | 29.7
| | S/N(c) | 14.9 | 25.4 | 27.7
| | SN(E/C) 0.53
|
| 
| 
| 
| 
| 
|
| 10220051
| 47
| | Red | Green | Blue
| | z | | 19.25
| | znorm | | 15.07
| | sky | 14.6 | 14.3 | 14.5
| | S/N | 17.1 | 27.7 | 30.3
| | S/N(c) | 15.4 | 25.8 | 28.4
| | SN(E/C) 0.49
|
| 
| 
| 
| 
| 
|
| 10220052
| 47
| | Red | Green | Blue
| | z | | 19.25
| | znorm | | 15.07
| | sky | 14.7 | 14.3 | 14.5
| | S/N | 17.5 | 28.0 | 30.3
| | S/N(c) | 15.5 | 26.1 | 28.4
| | SN(E/C) 0.51
|
| 
| 
| 
| 
| 
|
| 10220053
| 47
| | Red | Green | Blue
| | z | | 19.23
| | znorm | | 15.05
| | sky | 14.5 | 14.4 | 14.6
| | S/N | 17.5 | 27.9 | 30.1
| | S/N(c) | 15.5 | 25.8 | 28.1
| | SN(E/C) 0.49
|
| 
| 
| 
| 
| 
|
| 10220054
| 47
| | Red | Green | Blue
| | z | | 19.23
| | znorm | | 15.05
| | sky | 15.1 | 14.6 | 14.7
| | S/N | 17.4 | 27.9 | 30.1
| | S/N(c) | 15.5 | 26.0 | 28.2
| | SN(E/C) 0.49
|
| 
| 
| 
| 
| 
|
| 10220055
| 47
| | Red | Green | Blue
| | z | | 19.21
| | znorm | | 15.03
| | sky | 14.8 | 14.5 | 14.8
| | S/N | 17.4 | 27.9 | 29.6
| | S/N(c) | 15.5 | 25.9 | 28.1
| | SN(E/C) 0.52
|
| 
| 
| 
| 
| 
|
| 10220056
| 47
| | Red | Green | Blue
| | z | | 19.19
| | znorm | | 15.01
| | sky | 14.7 | 14.5 | 14.6
| | S/N | 16.9 | 27.4 | 29.2
| | S/N(c) | 15.0 | 25.4 | 27.8
| | SN(E/C) 0.52
|
| 
| 
| 
| 
| 
|
| 10220057
| 47
| | Red | Green | Blue
| | z | | 19.19
| | znorm | | 15.01
| | sky | 14.9 | 14.5 | 14.7
| | S/N | 17.2 | 27.6 | 29.5
| | S/N(c) | 14.8 | 26.1 | 28.1
| | SN(E/C) 0.50
|
| 
| 
| 
| 
| 
|

