| Red | Green | Blue | |
| z | 17.64 | ||
| znorm | Inf | ||
| sky | -NaN | -NaN | -Inf |
| S/N | 30.5 | 51.6 | 56.1 |
| S/N(c) | 0.0 | 0.0 | 0.0 |
| SN(E/C) |

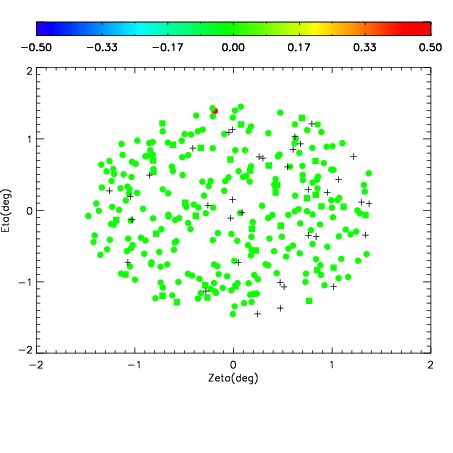
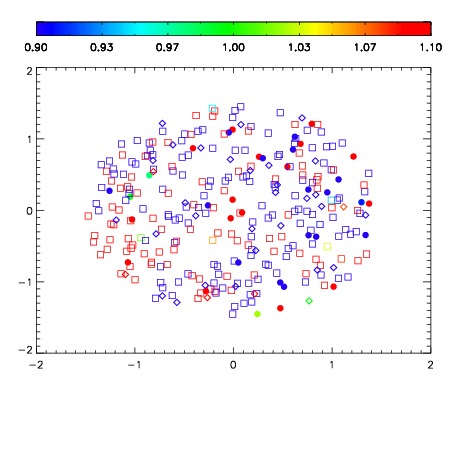
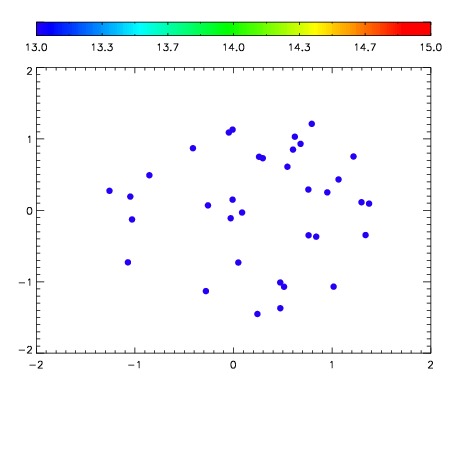

| Frame | Nreads | Zeropoints | Mag plots | Spatial mag deviation | Spatial sky 16325A emission deviations (filled: sky, open: star) | Spatial sky continuum emission | Spatial sky telluric CO2 absorption deviations (filled: H < 10) | |||||||||||||||||||||||
| 0 | 0 |
|
|
|
|
|
|
| IPAIR | NAME | SHIFT | NEWSHIFT | S/N | NAME | SHIFT | NEWSHIFT | S/N |
| 0 | 10220055 | 0.496484 | 0.00000 | 277.294 | 10220050 | 0.00000 | 0.496484 | 277.751 |
| 1 | 10220052 | 0.493171 | 0.00331300 | 280.398 | 10220053 | 0.00362065 | 0.492863 | 279.604 |
| 2 | 10220051 | 0.492751 | 0.00373301 | 280.170 | 10220054 | 0.00393265 | 0.492551 | 278.652 |
| 3 | 10220056 | 0.496097 | 0.000387013 | 275.333 | 10220057 | 0.00306919 | 0.493415 | 275.496 |