| Red | Green | Blue | |
| z | 17.64 | ||
| znorm | Inf | ||
| sky | -Inf | -Inf | -Inf |
| S/N | 29.3 | 50.4 | 57.1 |
| S/N(c) | 0.0 | 0.0 | 0.0 |
| SN(E/C) |

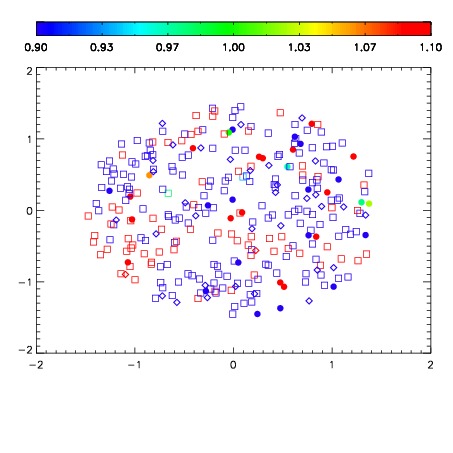
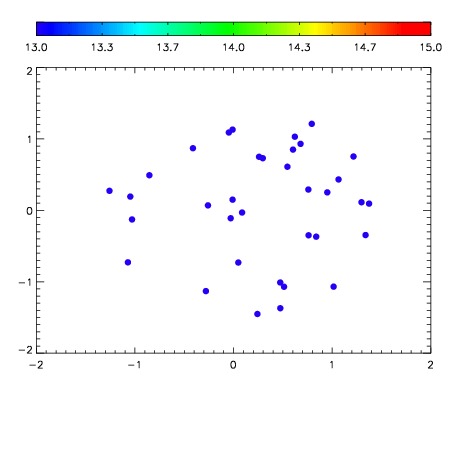

| Frame | Nreads | Zeropoints | Mag plots | Spatial mag deviation | Spatial sky 16325A emission deviations (filled: sky, open: star) | Spatial sky continuum emission | Spatial sky telluric CO2 absorption deviations (filled: H < 10) | |||||||||||||||||||||||
| 0 | 0 |
|
|
|
|
|
|
| IPAIR | NAME | SHIFT | NEWSHIFT | S/N | NAME | SHIFT | NEWSHIFT | S/N |
| 0 | 10260053 | 0.487478 | 0.00000 | 262.271 | 10260054 | 0.00137201 | 0.486106 | 262.950 |
| 1 | 10260052 | 0.487323 | 0.000155002 | 261.541 | 10260051 | 0.00239138 | 0.485087 | 259.021 |
| 2 | 10260049 | 0.487132 | 0.000345975 | 258.532 | 10260050 | 0.00312525 | 0.484353 | 258.263 |
| 3 | 10260048 | 0.487284 | 0.000193983 | 255.530 | 10260047 | 0.00000 | 0.487478 | 247.720 |