| Red | Green | Blue | |
| z | 17.64 | ||
| znorm | Inf | ||
| sky | -NaN | -Inf | -Inf |
| S/N | 24.6 | 42.6 | 46.9 |
| S/N(c) | 0.0 | 0.0 | 0.0 |
| SN(E/C) |
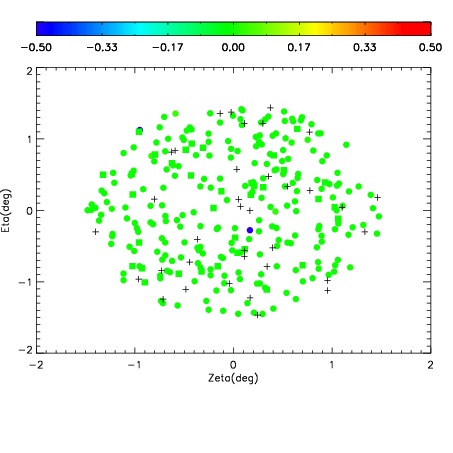

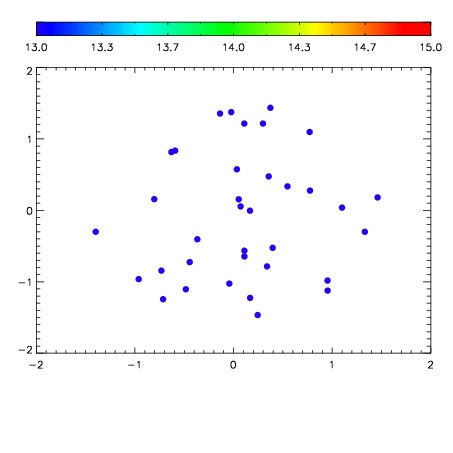

| Frame | Nreads | Zeropoints | Mag plots | Spatial mag deviation | Spatial sky 16325A emission deviations (filled: sky, open: star) | Spatial sky continuum emission | Spatial sky telluric CO2 absorption deviations (filled: H < 10) | |||||||||||||||||||||||
| 0 | 0 |
|
|
|
|
|
|
| IPAIR | NAME | SHIFT | NEWSHIFT | S/N | NAME | SHIFT | NEWSHIFT | S/N |
| 0 | 10250049 | 0.492884 | 0.00000 | 223.603 | 10250048 | 0.00000 | 0.492884 | 218.829 |
| 1 | 10250050 | 0.492831 | 5.30183e-05 | 220.472 | 10250052 | 0.00372243 | 0.489162 | 218.586 |
| 2 | 10250053 | 0.491335 | 0.00154901 | 218.700 | 10250051 | 0.00349842 | 0.489386 | 208.893 |
| 3 | 10250054 | 0.491813 | 0.00107101 | 212.545 | 10250055 | 0.00438718 | 0.488497 | 182.175 |