| Red | Green | Blue | |
| z | 17.64 | ||
| znorm | Inf | ||
| sky | -Inf | -Inf | -Inf |
| S/N | 25.8 | 45.2 | 50.2 |
| S/N(c) | 0.0 | 0.0 | 0.0 |
| SN(E/C) |
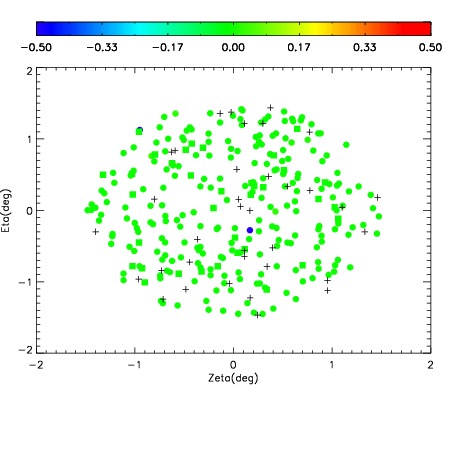
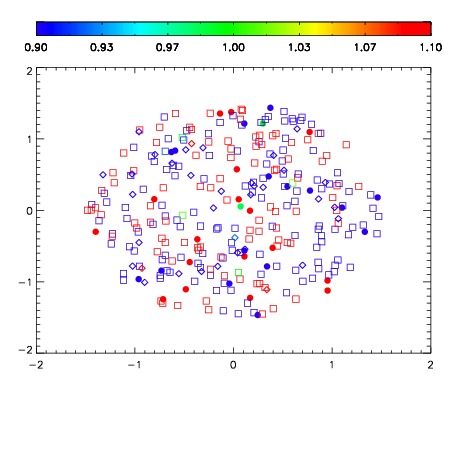
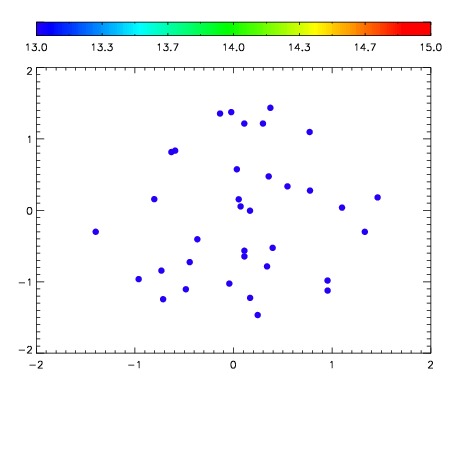

| Frame | Nreads | Zeropoints | Mag plots | Spatial mag deviation | Spatial sky 16325A emission deviations (filled: sky, open: star) | Spatial sky continuum emission | Spatial sky telluric CO2 absorption deviations (filled: H < 10) | |||||||||||||||||||||||
| 0 | 0 |
|
|
|
|
|
|
| IPAIR | NAME | SHIFT | NEWSHIFT | S/N | NAME | SHIFT | NEWSHIFT | S/N |
| 0 | 10450034 | 0.508958 | 0.00000 | 222.887 | 10450033 | 0.00000 | 0.508958 | 219.374 |
| 1 | 10450038 | 0.504028 | 0.00492996 | 223.774 | 10450040 | 0.00234450 | 0.506613 | 229.442 |
| 2 | 10450039 | 0.504598 | 0.00435996 | 221.817 | 10450036 | 0.00423953 | 0.504718 | 215.081 |
| 3 | 10450035 | 0.508748 | 0.000209987 | 218.769 | 10450037 | 0.00443172 | 0.504526 | 212.603 |