| Red | Green | Blue | |
| z | 17.64 | ||
| znorm | Inf | ||
| sky | -Inf | -Inf | -Inf |
| S/N | 25.4 | 43.3 | 48.3 |
| S/N(c) | 0.0 | 0.0 | 0.0 |
| SN(E/C) |
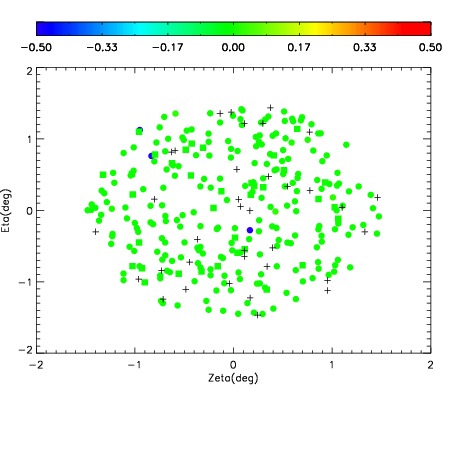
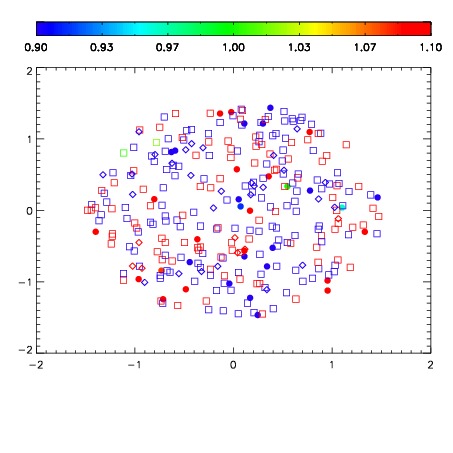
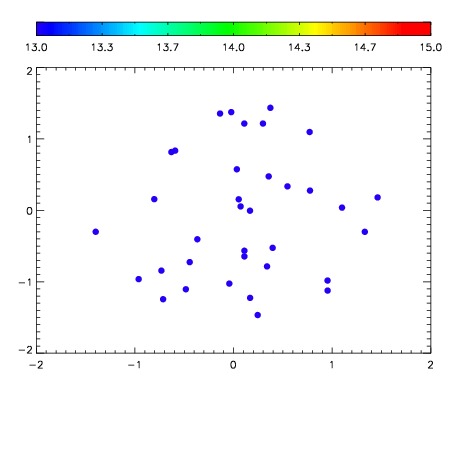

| Frame | Nreads | Zeropoints | Mag plots | Spatial mag deviation | Spatial sky 16325A emission deviations (filled: sky, open: star) | Spatial sky continuum emission | Spatial sky telluric CO2 absorption deviations (filled: H < 10) | |||||||||||||||||||||||
| 0 | 0 |
|
|
|
|
|
|
| IPAIR | NAME | SHIFT | NEWSHIFT | S/N | NAME | SHIFT | NEWSHIFT | S/N |
| 0 | 10540039 | 0.500512 | 0.00000 | 206.181 | 10540037 | 0.00000 | 0.500512 | 207.290 |
| 1 | 10540042 | 0.499265 | 0.00124702 | 209.334 | 10540041 | 0.000957115 | 0.499555 | 214.919 |
| 2 | 10540038 | 0.500325 | 0.000186980 | 208.826 | 10540040 | 0.00138157 | 0.499130 | 208.528 |
| 3 | 10540043 | 0.500125 | 0.000387013 | 196.906 | 10540044 | 0.00259675 | 0.497915 | 186.730 |