| Red | Green | Blue | |
| z | 17.64 | ||
| znorm | Inf | ||
| sky | -Inf | -NaN | -Inf |
| S/N | 27.5 | 49.2 | 53.3 |
| S/N(c) | 0.0 | 0.0 | 0.0 |
| SN(E/C) |
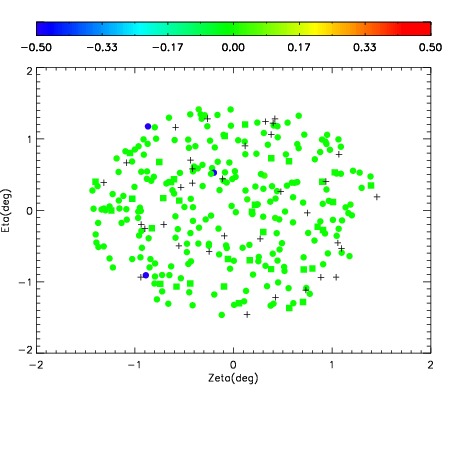
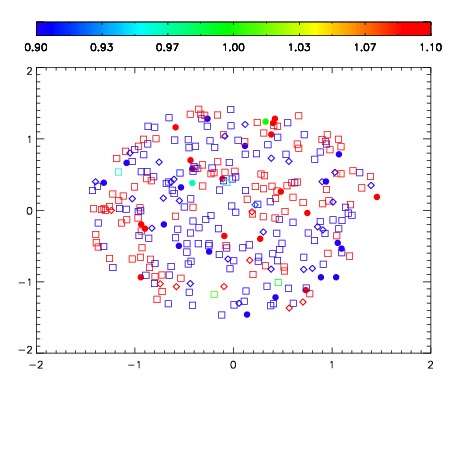
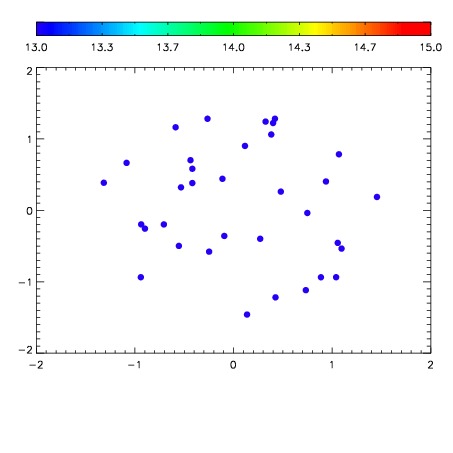

| Frame | Nreads | Zeropoints | Mag plots | Spatial mag deviation | Spatial sky 16325A emission deviations (filled: sky, open: star) | Spatial sky continuum emission | Spatial sky telluric CO2 absorption deviations (filled: H < 10) | |||||||||||||||||||||||
| 0 | 0 |
|
|
|
|
|
|
| IPAIR | NAME | SHIFT | NEWSHIFT | S/N | NAME | SHIFT | NEWSHIFT | S/N |
| 0 | 10230054 | 0.502945 | 0.00000 | 228.815 | 10230056 | 0.000643782 | 0.502301 | 231.667 |
| 1 | 10230055 | 0.502616 | 0.000329018 | 225.145 | 10230053 | 0.000683089 | 0.502262 | 224.466 |
| 2 | 10230051 | 0.500239 | 0.00270599 | 224.320 | 10230052 | 0.00111340 | 0.501832 | 219.522 |
| 3 | 10230050 | 0.500486 | 0.00245899 | 222.998 | 10230049 | 0.00000 | 0.502945 | 217.967 |