| Red | Green | Blue | |
| z | 17.64 | ||
| znorm | Inf | ||
| sky | -Inf | -Inf | -Inf |
| S/N | 16.9 | 29.4 | 33.1 |
| S/N(c) | 0.0 | 0.0 | 0.0 |
| SN(E/C) |

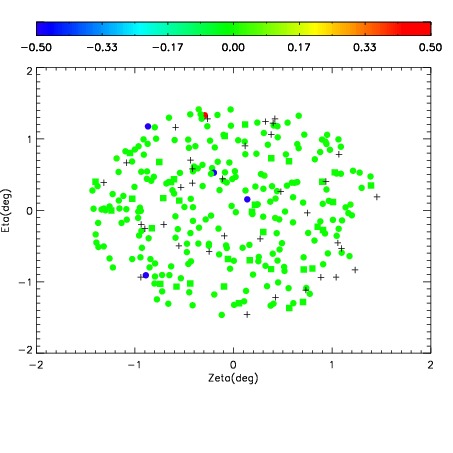
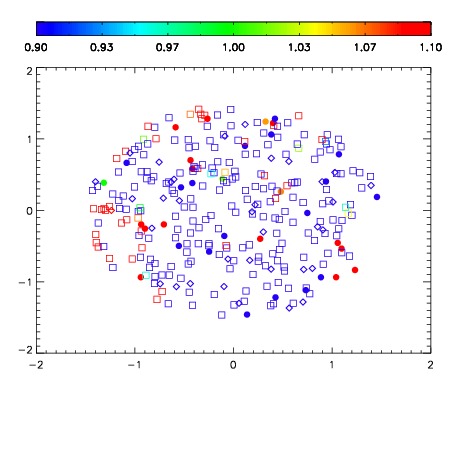
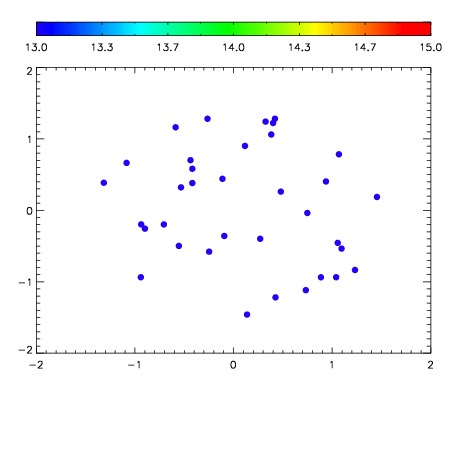

| Frame | Nreads | Zeropoints | Mag plots | Spatial mag deviation | Spatial sky 16325A emission deviations (filled: sky, open: star) | Spatial sky continuum emission | Spatial sky telluric CO2 absorption deviations (filled: H < 10) | |||||||||||||||||||||||
| 0 | 0 |
|
|
|
|
|
|
| IPAIR | NAME | SHIFT | NEWSHIFT | S/N | NAME | SHIFT | NEWSHIFT | S/N |
| 0 | 10270046 | 0.496190 | 0.00000 | 30.5453 | 10270044 | 0.00000 | 0.496190 | 80.8169 |
| 1 | 10270050 | 0.494447 | 0.00174302 | 222.589 | 10270051 | 0.000802940 | 0.495387 | 233.583 |
| 2 | 10270049 | 0.493998 | 0.00219202 | 208.811 | 10270048 | -0.000750606 | 0.496941 | 147.412 |