| Red | Green | Blue | |
| z | 17.64 | ||
| znorm | Inf | ||
| sky | -Inf | -NaN | -Inf |
| S/N | 26.5 | 46.0 | 50.7 |
| S/N(c) | 0.0 | 0.0 | 0.0 |
| SN(E/C) |
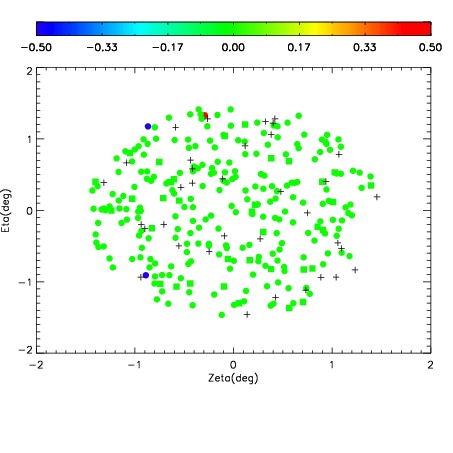
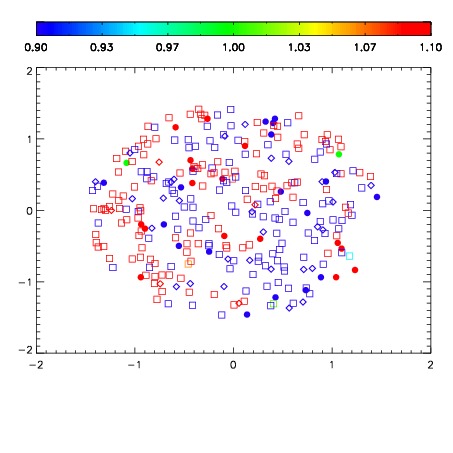
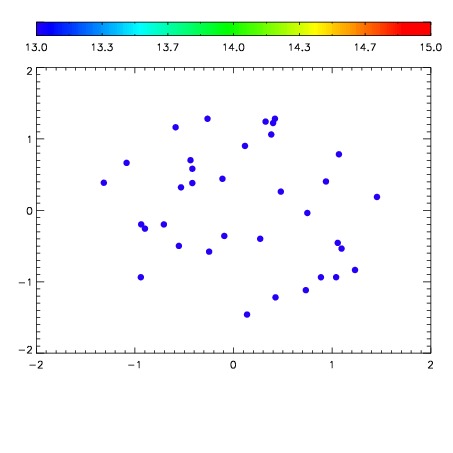

| Frame | Nreads | Zeropoints | Mag plots | Spatial mag deviation | Spatial sky 16325A emission deviations (filled: sky, open: star) | Spatial sky continuum emission | Spatial sky telluric CO2 absorption deviations (filled: H < 10) | |||||||||||||||||||||||
| 0 | 0 |
|
|
|
|
|
|
| IPAIR | NAME | SHIFT | NEWSHIFT | S/N | NAME | SHIFT | NEWSHIFT | S/N |
| 0 | 10520024 | 0.506070 | 0.00000 | 220.372 | 10520027 | 0.00955115 | 0.496519 | 207.273 |
| 1 | 10520025 | 0.505085 | 0.000985026 | 229.077 | 10520023 | 0.00000 | 0.506070 | 227.589 |
| 2 | 10520029 | 0.505606 | 0.000464022 | 228.529 | 10520030 | 0.0296535 | 0.476417 | 224.302 |
| 3 | 10520028 | 0.505441 | 0.000629008 | 227.751 | 10520026 | 0.00894354 | 0.497126 | 220.390 |