| Red | Green | Blue | |
| z | 17.64 | ||
| znorm | Inf | ||
| sky | -Inf | -NaN | -Inf |
| S/N | 19.3 | 36.2 | 38.4 |
| S/N(c) | 0.0 | 0.0 | 0.0 |
| SN(E/C) |

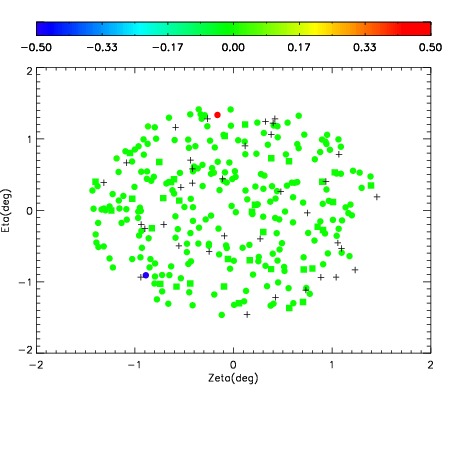
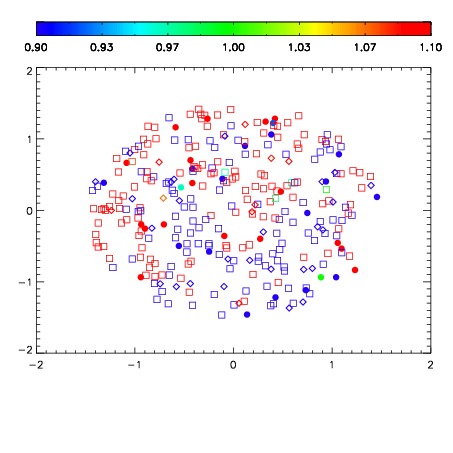


| Frame | Nreads | Zeropoints | Mag plots | Spatial mag deviation | Spatial sky 16325A emission deviations (filled: sky, open: star) | Spatial sky continuum emission | Spatial sky telluric CO2 absorption deviations (filled: H < 10) | |||||||||||||||||||||||
| 0 | 0 |
|
|
|
|
|
|
| IPAIR | NAME | SHIFT | NEWSHIFT | S/N | NAME | SHIFT | NEWSHIFT | S/N |
| 0 | 10800013 | 0.490466 | 0.00000 | 185.209 | 10800011 | 0.00000 | 0.490466 | 177.484 |
| 1 | 10800016 | 0.489922 | 0.000544012 | 198.543 | 10800018 | -0.000677180 | 0.491143 | 206.232 |
| 2 | 10800017 | 0.490441 | 2.50041e-05 | 193.362 | 10800015 | -0.00247475 | 0.492941 | 189.206 |
| 3 | 10800012 | 0.489648 | 0.000817984 | 170.655 | 10800014 | -0.00269745 | 0.493163 | 175.144 |