| Frame | Nreads | Zeropoints | Mag plots
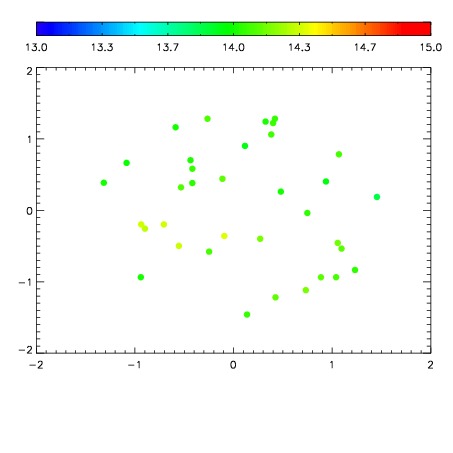
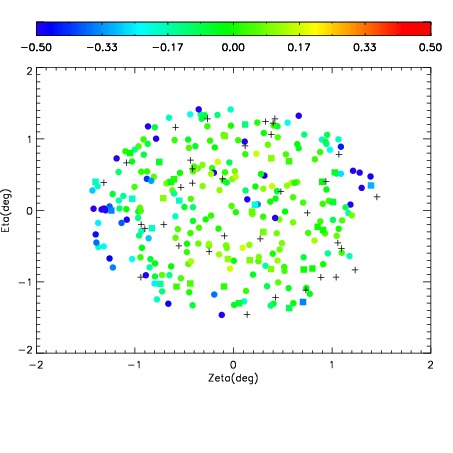
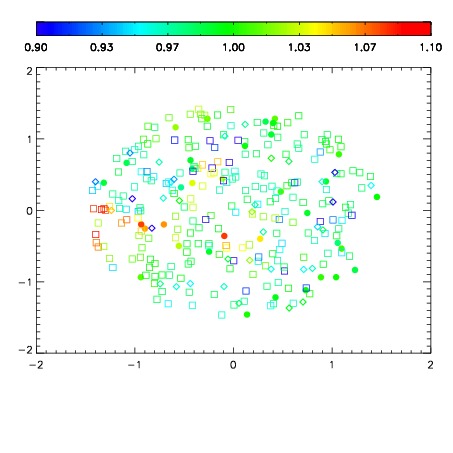
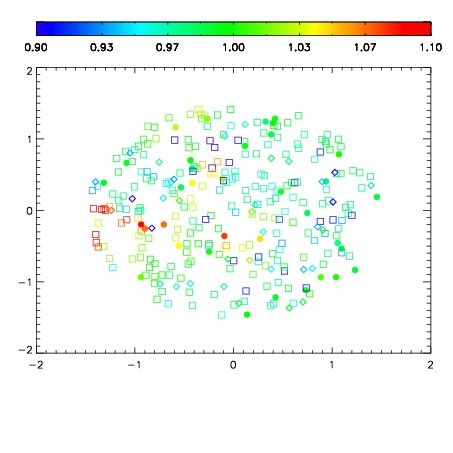
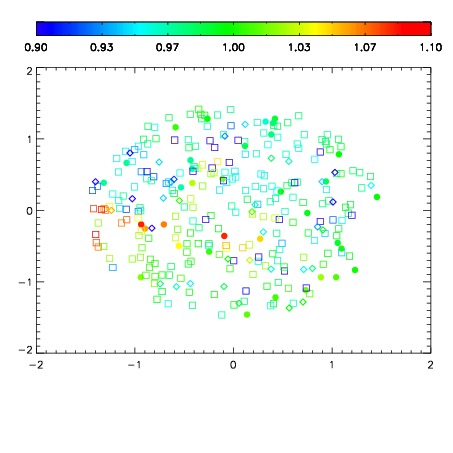
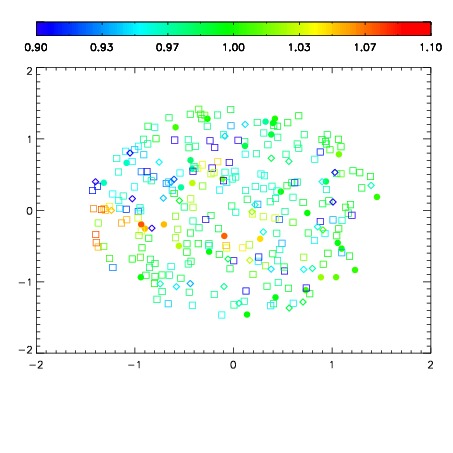
| Spatial mag deviation
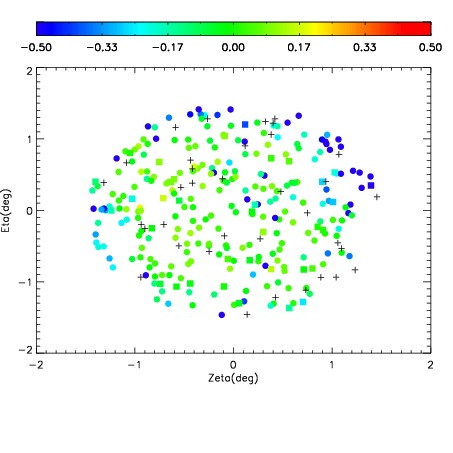
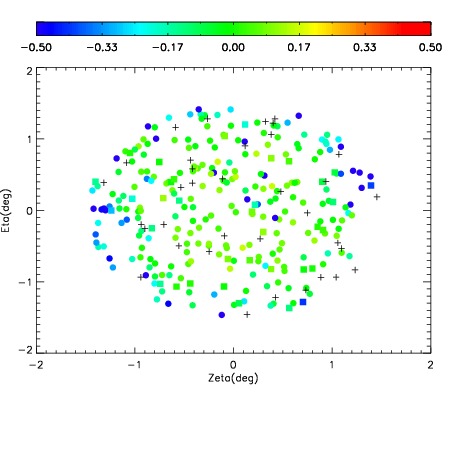
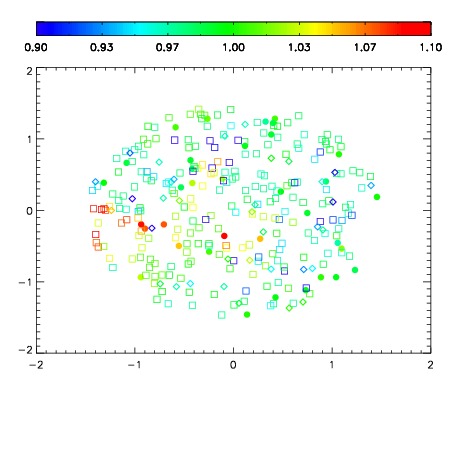
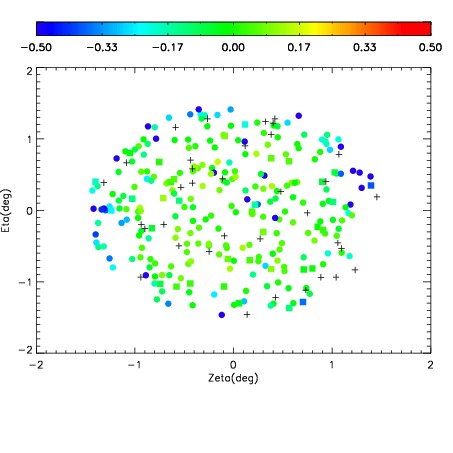
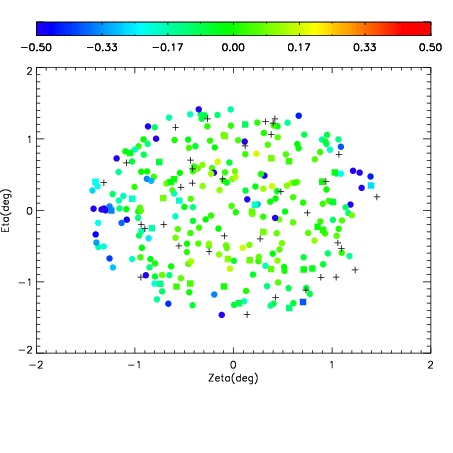
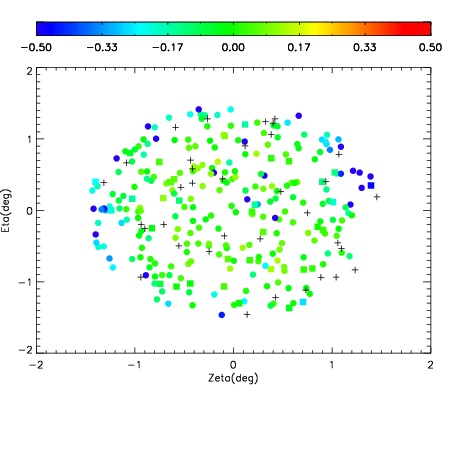
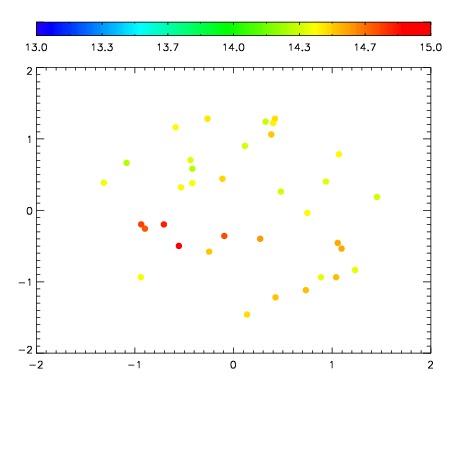
| Spatial sky 16325A emission deviations (filled: sky, open: star)
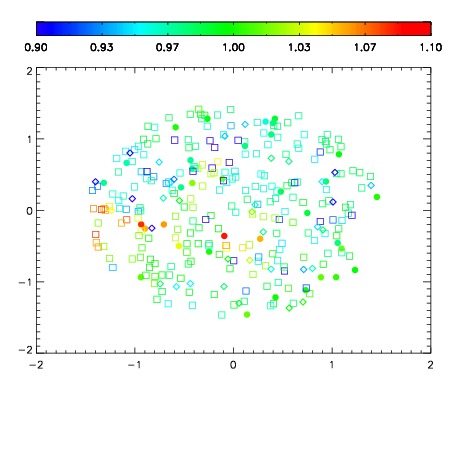
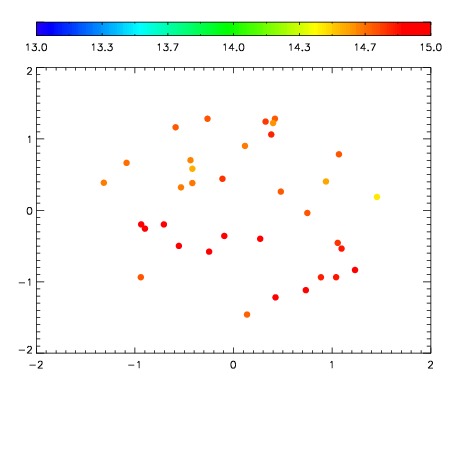
| Spatial sky continuum emission
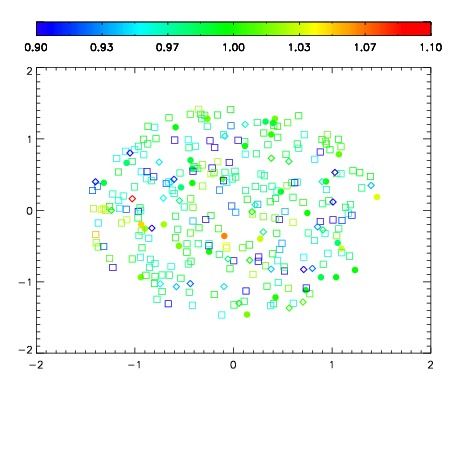
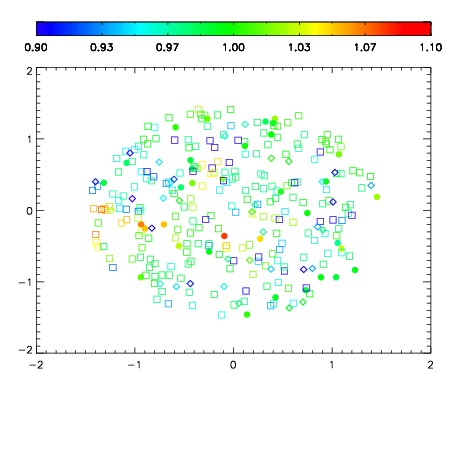
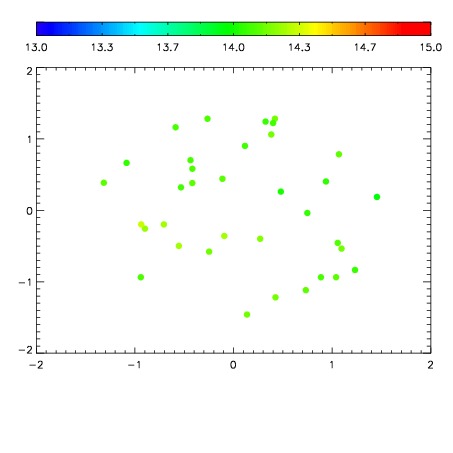
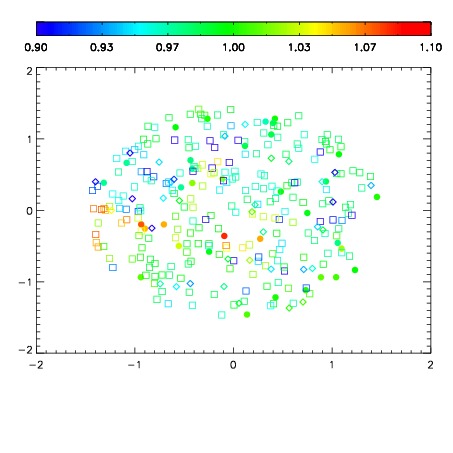
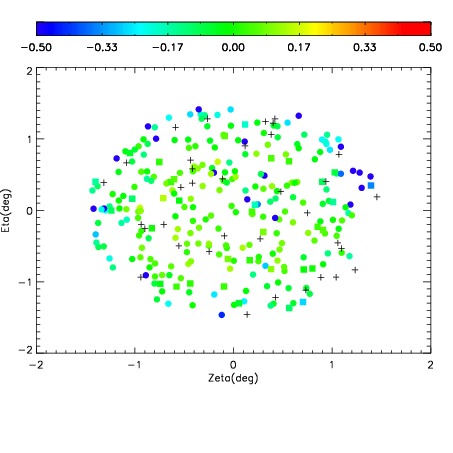
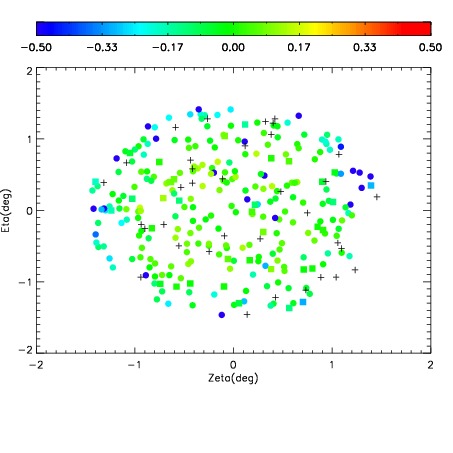
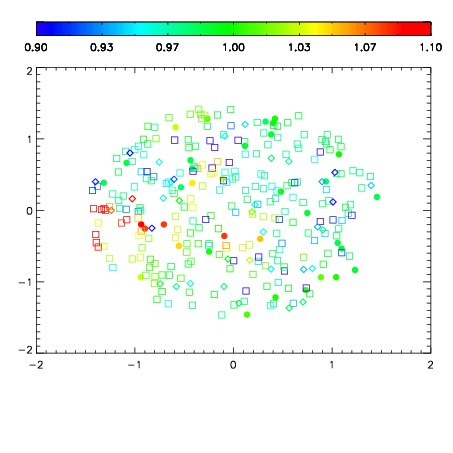
| Spatial sky telluric CO2 absorption deviations (filled: H < 10)
|
| 10820011
| 47
| | Red | Green | Blue
| | z | | 19.05
| | znorm | | 14.87
| | sky | 14.5 | 14.1 | 13.9
| | S/N | 15.5 | 25.2 | 26.1
| | S/N(c) | 13.7 | 23.2 | 24.8
| | SN(E/C) 0.44
|
| 
| 
| 
| 
| 
|
| 10820012
| 47
| | Red | Green | Blue
| | z | | 18.94
| | znorm | | 14.76
| | sky | 14.5 | 14.3 | 14.3
| | S/N | 14.6 | 24.3 | 25.7
| | S/N(c) | 12.8 | 22.1 | 23.9
| | SN(E/C) 0.42
|
| 
| 
| 
| 
| 
|
| 10820013
| 47
| | Red | Green | Blue
| | z | | 18.61
| | znorm | | 14.43
| | sky | 14.4 | 14.1 | 14.2
| | S/N | 11.0 | 19.8 | 20.4
| | S/N(c) | 9.5 | 17.8 | 18.8
| | SN(E/C) 0.46
|
| 
| 
| 
| 
| 
|
| 10820014
| 47
| | Red | Green | Blue
| | z | | 18.72
| | znorm | | 14.54
| | sky | 14.4 | 14.3 | 14.4
| | S/N | 12.0 | 21.0 | 22.5
| | S/N(c) | 10.4 | 18.9 | 20.5
| | SN(E/C) 0.44
|
| 
| 
| 
| 
| 
|
| 10820015
| 47
| | Red | Green | Blue
| | z | | 18.64
| | znorm | | 14.46
| | sky | 14.4 | 14.2 | 14.5
| | S/N | 11.3 | 19.9 | 21.0
| | S/N(c) | 9.7 | 17.9 | 19.4
| | SN(E/C) 0.48
|
| 
| 
| 
| 
| 
|
| 10820016
| 47
| | Red | Green | Blue
| | z | | 18.53
| | znorm | | 14.35
| | sky | 14.7 | 14.5 | 14.5
| | S/N | 10.6 | 18.8 | 19.8
| | S/N(c) | 9.0 | 16.9 | 18.0
| | SN(E/C) 0.47
|
| 
| 
| 
| 
| 
|
| 10820017
| 47
| | Red | Green | Blue
| | z | | 18.84
| | znorm | | 14.66
| | sky | 14.9 | 14.7 | 14.7
| | S/N | 13.5 | 22.6 | 23.9
| | S/N(c) | 11.6 | 20.6 | 22.0
| | SN(E/C) 0.43
|
| 
| 
| 
| 
| 
|
| 10820018
| 47
| | Red | Green | Blue
| | z | | 18.96
| | znorm | | 14.78
| | sky | 14.9 | 14.7 | 14.7
| | S/N | 14.6 | 23.8 | 25.9
| | S/N(c) | 12.7 | 22.0 | 24.3
| | SN(E/C) 0.41
|
| 
| 
| 
| 
| 
|
| 10820019
| 47
| | Red | Green | Blue
| | z | | 18.92
| | znorm | | 14.74
| | sky | 14.7 | 14.5 | 14.7
| | S/N | 14.3 | 23.3 | 25.1
| | S/N(c) | 12.3 | 21.4 | 23.3
| | SN(E/C) 0.41
|
| 
| 
| 
| 
| 
|
| 10820020
| 47
| | Red | Green | Blue
| | z | | 19.08
| | znorm | | 14.90
| | sky | 14.7 | 14.4 | 14.5
| | S/N | 15.6 | 25.2 | 27.6
| | S/N(c) | 13.7 | 23.4 | 25.9
| | SN(E/C) 0.40
|
| 
| 
| 
| 
| 
|